Marine Technician Jimbo (Paul Duncan) has spent all night, every night, for 24 nights keeping the Falkor’s multibeam sonar operational and recording data.
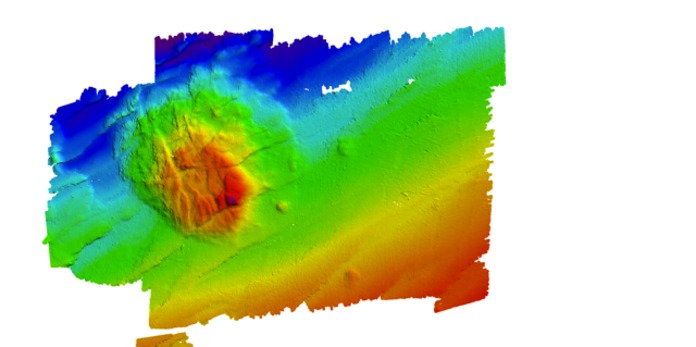
The sonar sends “pings” of sound to the sea floor. The pings bounce back. The length of time between sending and receiving can be converted to depth. Each pulse sends over 400 pings of sound and many pulses are sent every minute. From the millions of bits of data from the pings, highly detailed bathymetric maps can be created.
Multibeam sonar
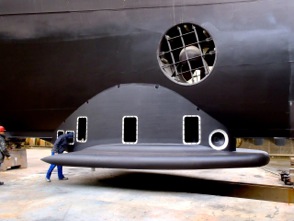
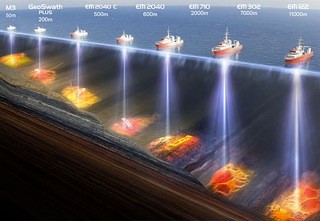
The multibeam sonar on the RV Falkor is an EM302 which operates at 30 kilohertz. It has two arrays on the gondola (a special addition on the hull of the ship near the bow, see photo). One of the arrays transmits sound waves and the other receives them after they bounce back from the sea floor.
Sonar with a low frequency can return signals from greater depths, whereas sonar operating with a high frequency can give a higher resolution, but at a shorter range. The Falkor also has an EA600 that operates at 12 kilohertz and can accurately determine the depth in the deepest trenches.
Geologist Dr. Patty Fryer uses the data the sonar collects to create maps for each day’s lander deployments. Each evening she tells Jimbo the plans for the next day. Jimbo then make the schedule for the night’s mapping. Driving the ship back and fourth over the target area is called “running the lines” or “mowing the lawn.”
The multibeam sonar can also show backscatter, which give an indication as to the roughness of the sea floor. A hard sea floor of rock sends back a strong, high energy signal. Sediment scatters some of the sound energy and returns a softer signal.
Accuracy is key
Accurate bathymetric maps are vital on this expedition where we are deploying a variety of landers at depths from 3.5 to almost 7 miles. The camera lander works best on a flat bottom, the coring respirometer needs to land in sediment, the fish trap and the wee trap are always happy, but the rock grabber is picky—sometimes wanting rocks, but at other times it wants sediments and mud.
To make really great bathymetric maps, the data must be “cleaned.” I call this zapping the dots. For every hour of data collected, Jimbo spends about a half an hour zapping wayward dots. This is not exciting, it takes dedication and a love of great maps to make it work.
CTD: Conductivity, Temperature, Depth
The maker of maps, the supervisor of pings, must also consider the temperature and salinity of the ocean where the sonar is operating. Although sound travels through water at about 1500 meters/second, it doesn’t travel uniformly everywhere. The ship uses an apparatus called a CTD (see photo) to determine temperature and salinity. During a prolonged mapping cruise, the CTD will be deployed every few days and the multibeam sonar will be calibrated (adjusted) accordingly.
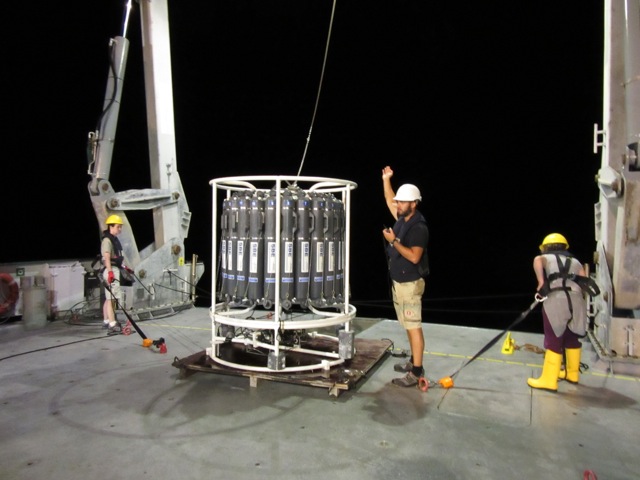
The CTD is found on most research vessels. It is a series of water bottles arranged on a wheel called a rosette. The CTD is deployed at a predetermined depth and each water bottle closes at a specific depth as it is brought to the surface. There are sensors that measure C-conductivity, T-temperature and D-depth. The conductivity is a measure of salinity. Many other sensors can be on a CTD to measure a variety of water properties like chemical concentrations and oxygen levels.
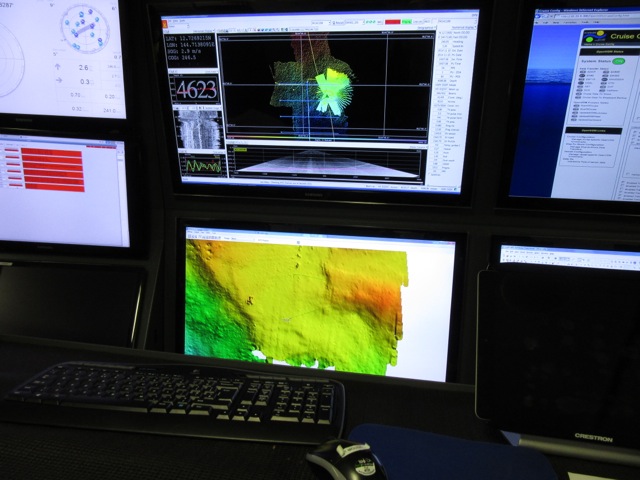
To view what Jimbo sees, check out the The Meaning of Life or at least a Multibeam Acquisition Display blog on how to read the mapping screen in the control room.