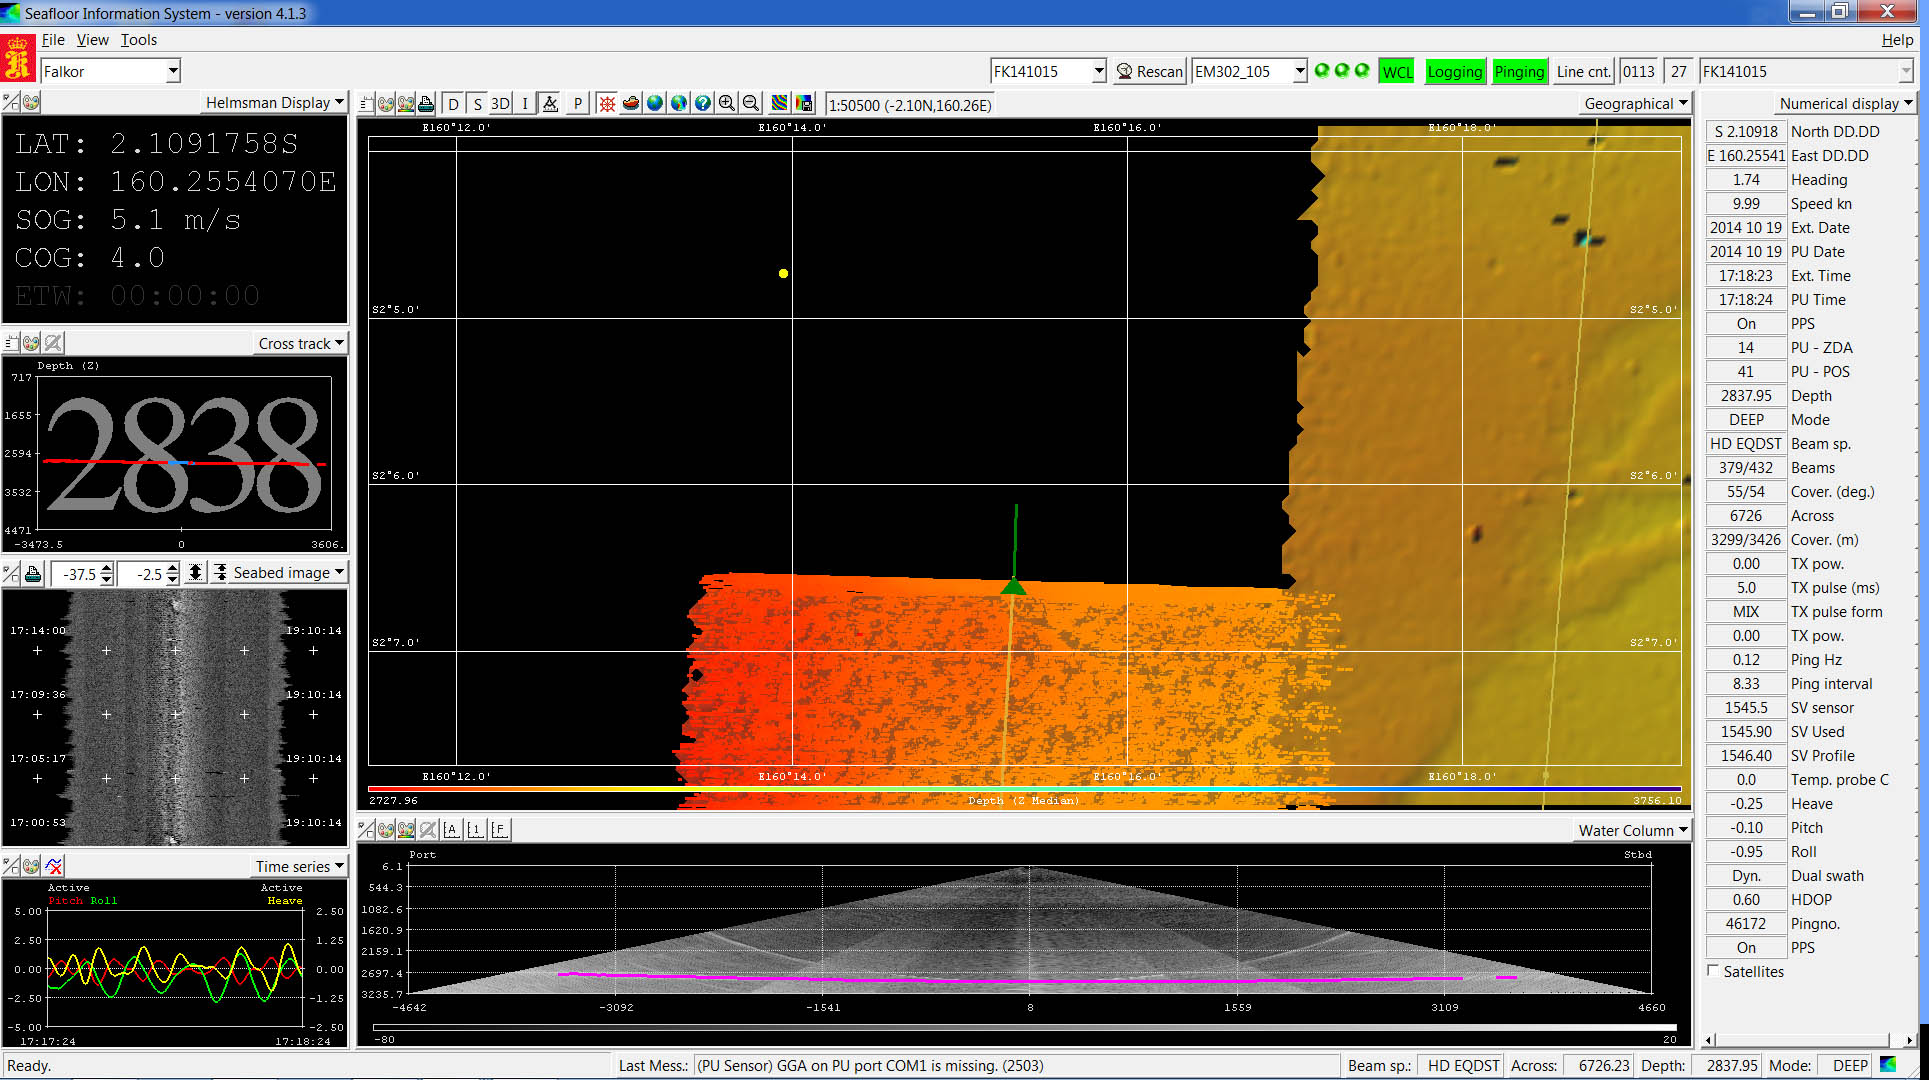
When mapping the seafloor, a key display in the Science Control Room is the multibeam echosounding data acquisition screen. It contains a wealth of information, so let’s take a look. You may have to click on the images to enlarge them to see some of the detail.
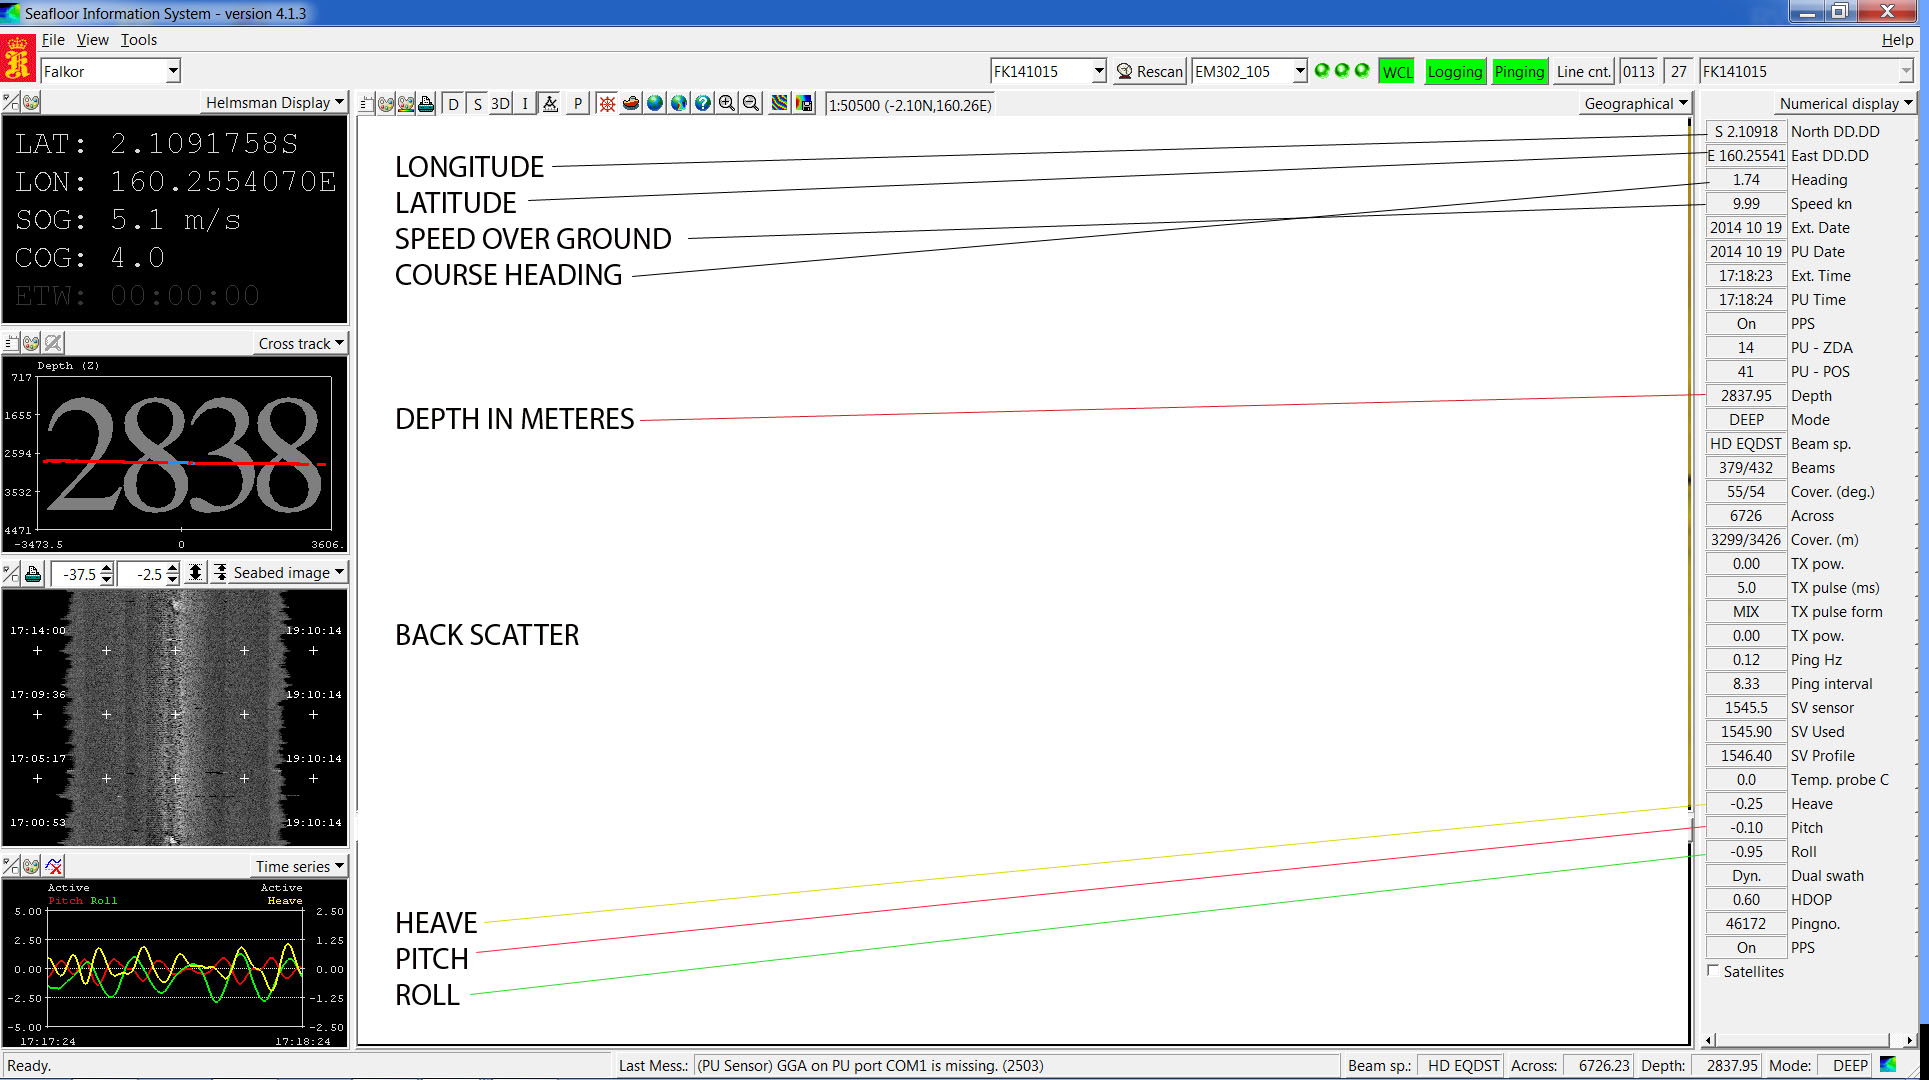
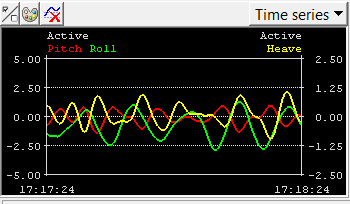
First off, to the left and to the right of the colored center images are several informational windows. The Falkor’s position in latitude and longitude, SOG (speed over ground), and COG (course over ground) are precisely calculated by GPS and relate to the ship’s speed and heading. Next is depth directly beneath Falkor, again precisely calculated using water property data collected by the shipboard science team. Below that is a colored graph on the ship’s heave (vertical displacement of the whole vessel up and down in the water due to waves and swell), pitch (movement of the bow and stern up and down in the waves) and roll (port to starboard roll).
Note that for the data displayed, the Falkor was experiencing calm seas. Maximum heave was about 1.25 meters in the open ocean. In calm waters the ship can map faster with fewer data gaps. We will not cover all of the parameters listed in the column on the right, as the blog would be too long! Some of the less intuitive entries have to do with settings for the multibeam echosounding system.
Next, take a look at the center of the acquisition display. Basic color relates to depth as can be seen by the color bar at the bottom of the upper window. The ship and its heading are indicated by the green triangle and heading line (circled with green). In this case, one swath of ocean bottom has already been mapped and the Falkor is now “painting” a second line. The dashed blue lines indicate the overlap to make sure nothing is missed. Looking at the swath already complete to the right side of the screen, some basic features of the area are apparent. Note the scarp and some other topography of the canyon (yellow arrow). Black holes indicate where multibeam data were not collected (circled in yellow).
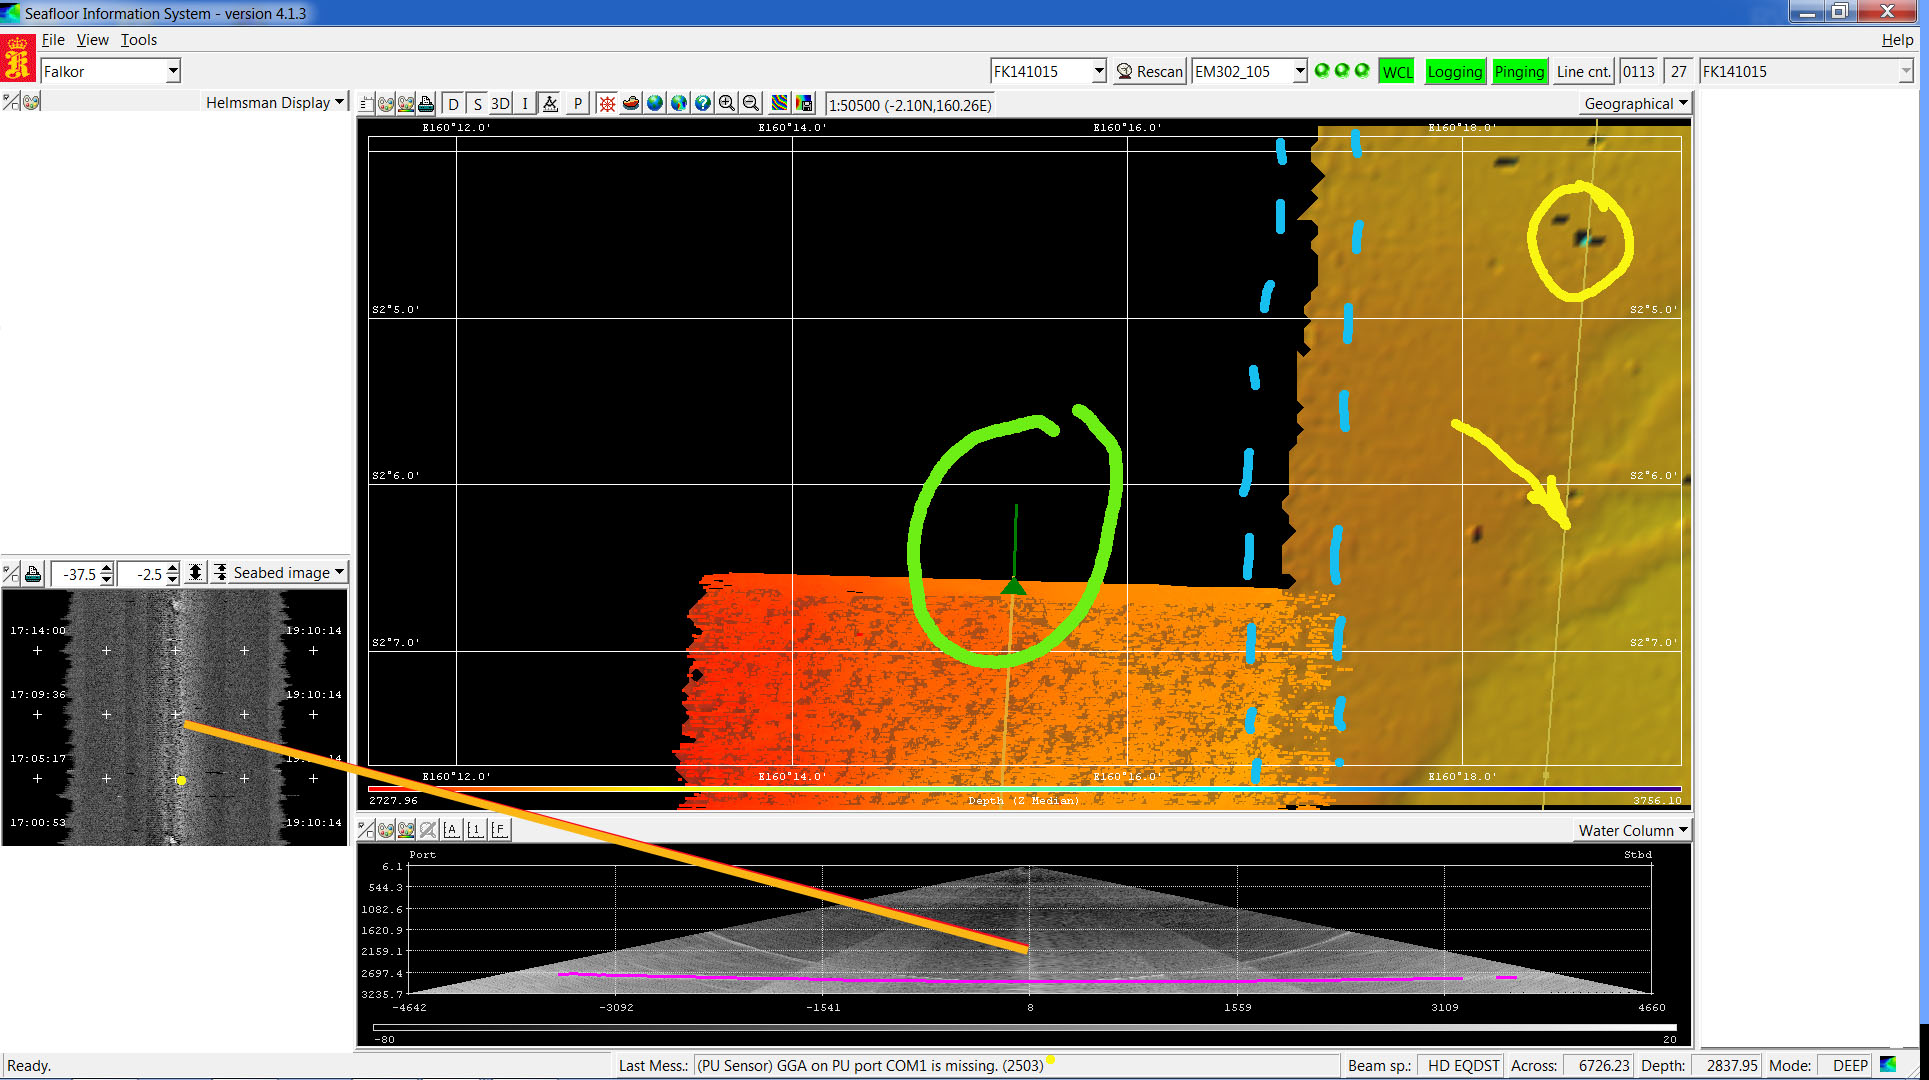
The black and white screen below this labeled “Water column” is as if we were in the water beneath the stern of the ship looking forward and seeing the swath of echosounding beams going down through the water column to the seafloor below. The red line is the seafloor. A large school of fish or a methane seep might show up between the seafloor and the top of the swath.
Finally, the backscatter screen shows the intensity of the return signal. This indicates information about the hardness (acoustic impedance) of the bottom. Hard rock shows up bright white, while soft sediment appears dark. Basically softer sediment absorbs more of the sound, whereas harder surfaces reflect more of the sound back to the ship. The screen is divided into three sectors merely due to the echosounder array structure. As indicated by the orange line, the center of this screen corresponds to the center of the array. This screen shows raw data that has not been processed yet.
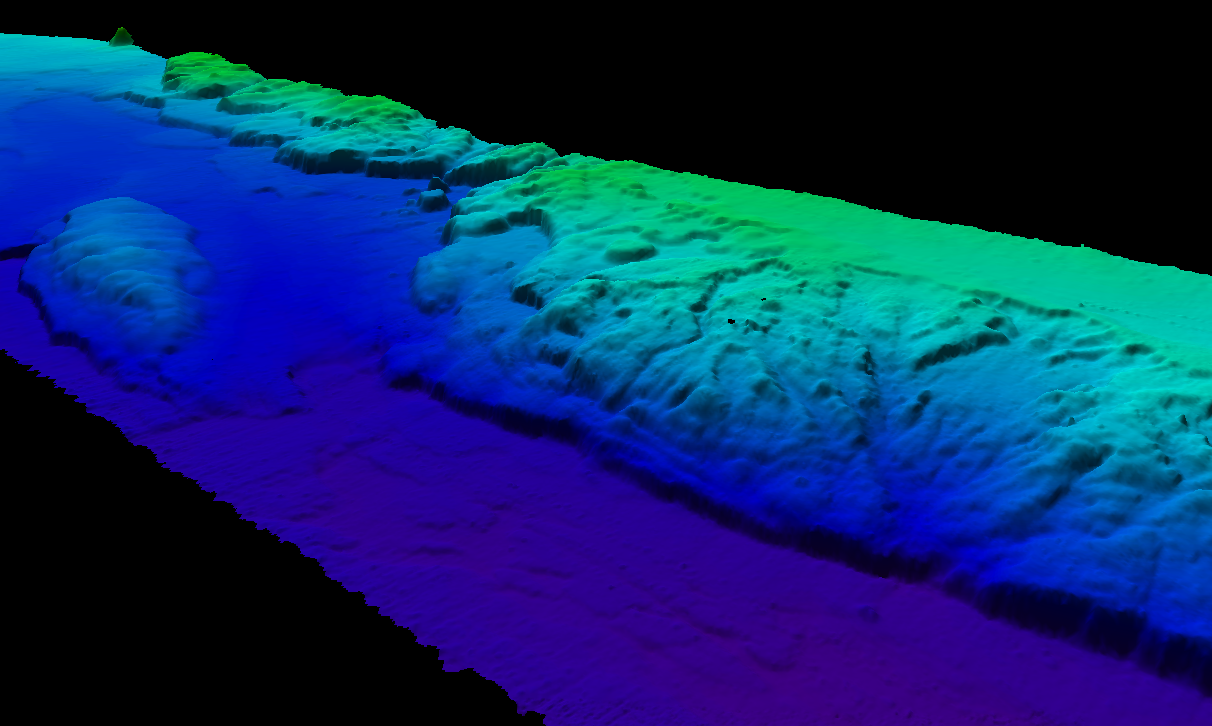
All of this information is then cleaned of suspect data and processed. The result is beautiful 3D map of the ocean floor at a level of resolution not possible with older techniques or satellite-derived predicted bathymetry.