One of the first things you notice being on a ship – rather than land – is the motion. Your foundation is always moving, making simple tasks (like taking a shower or walking down a hallway) into dynamic actions, as compared the almost thoughtless, natural acts completed while being on solid ground.
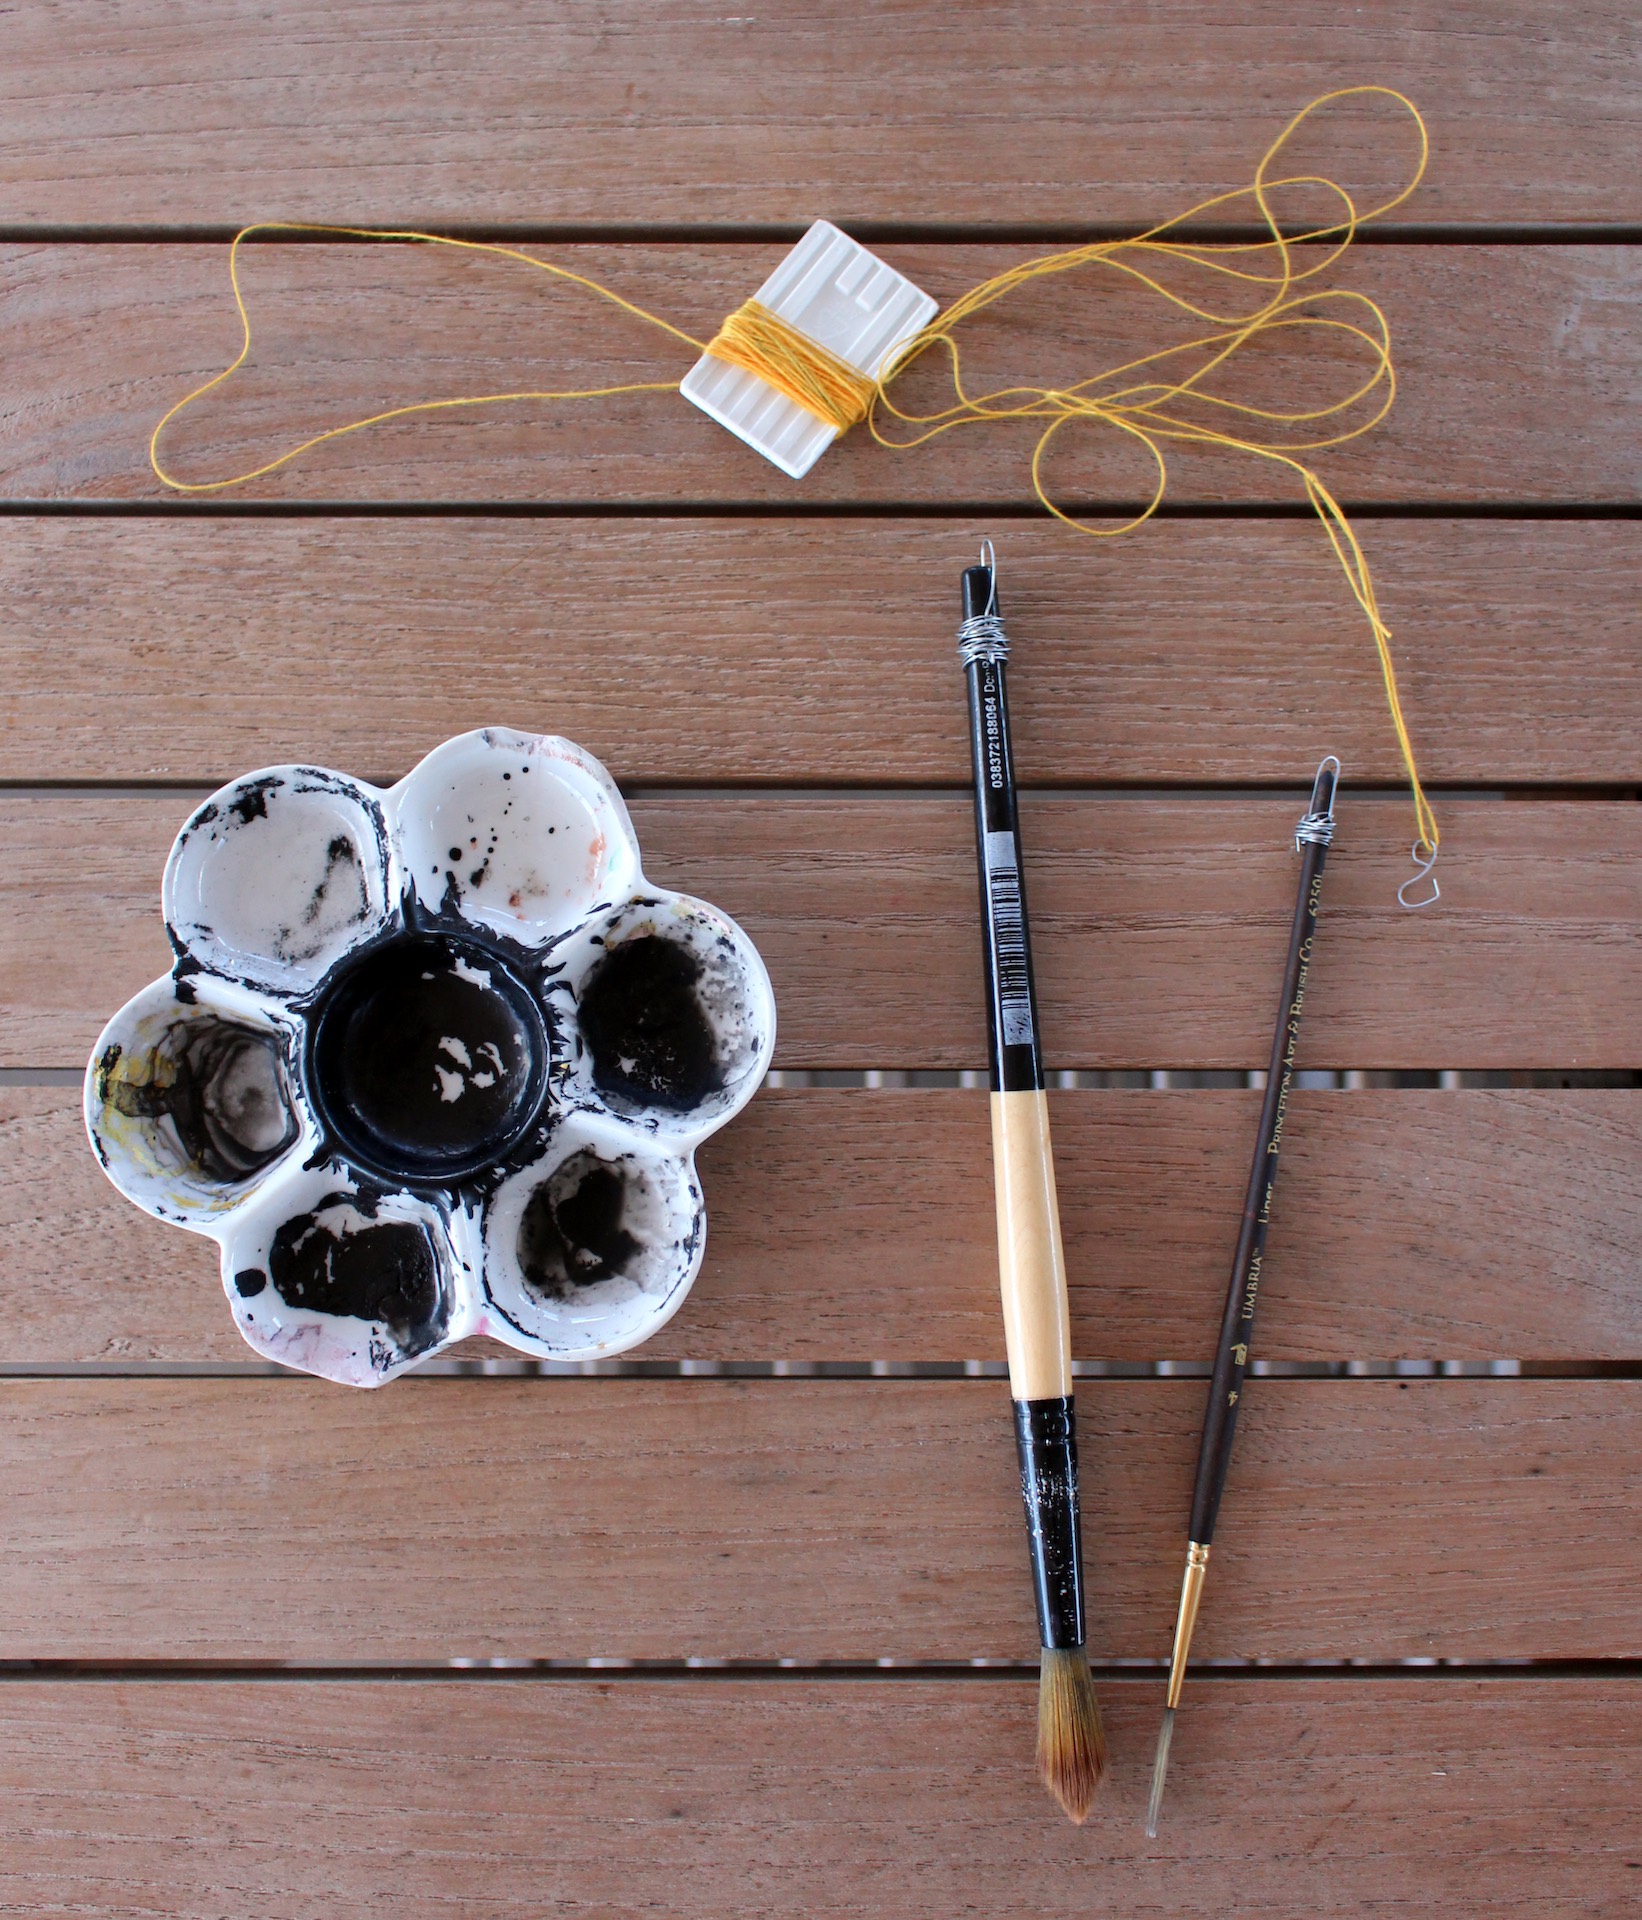
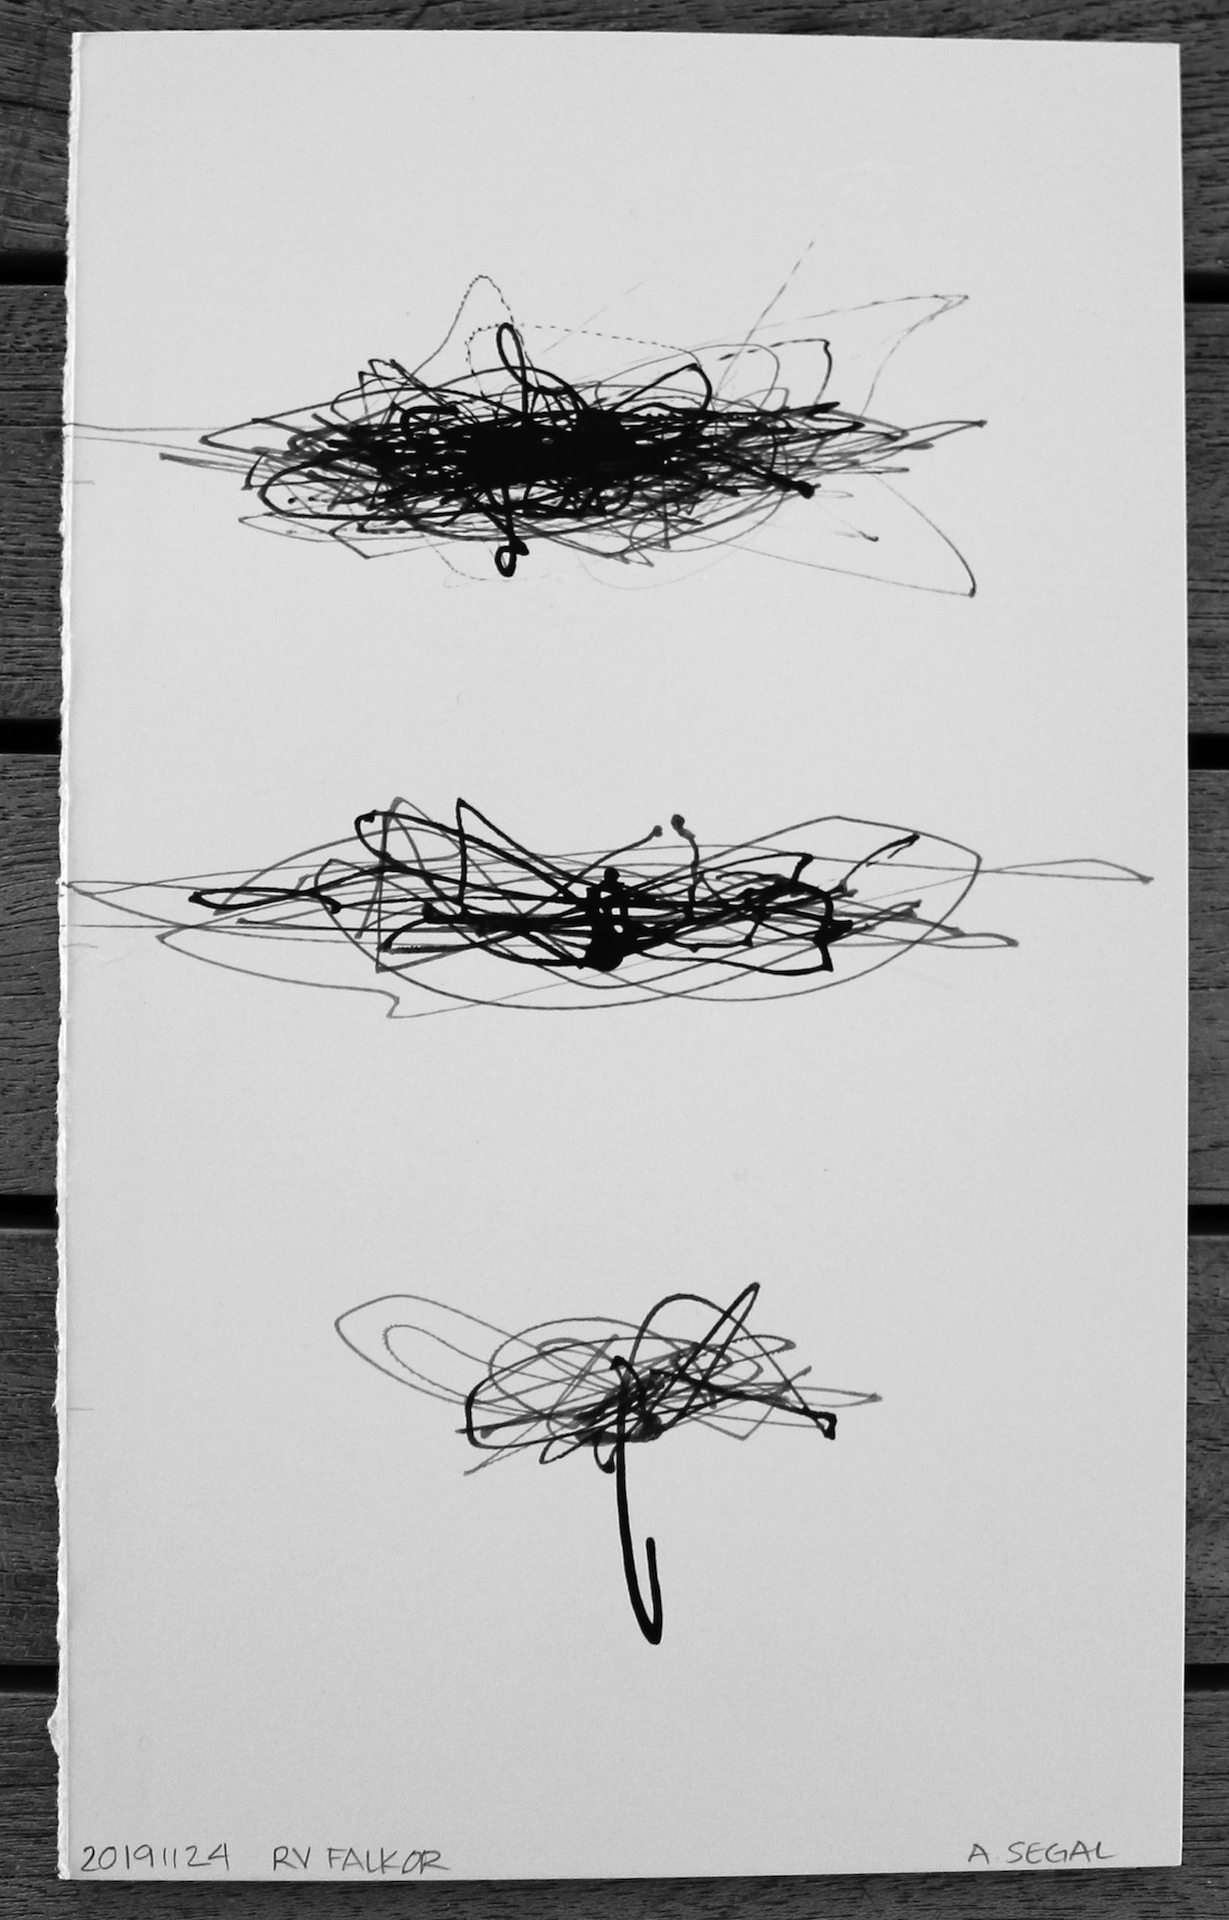
Seeking to understand the degree of motion felt on the Falkor on the open ocean, I began a drawing experiment using simple instruments (thread, wire, ink, and a brush) to capture the pitch and roll of the ship as a series of drawings. The brush is suspended in air like a pendulum, swaying back and forth (pitch) and side to side (roll), seeking center through a force of gravity. Each drawing captures a moment of the effect of the ocean’s waves on the Falkor.
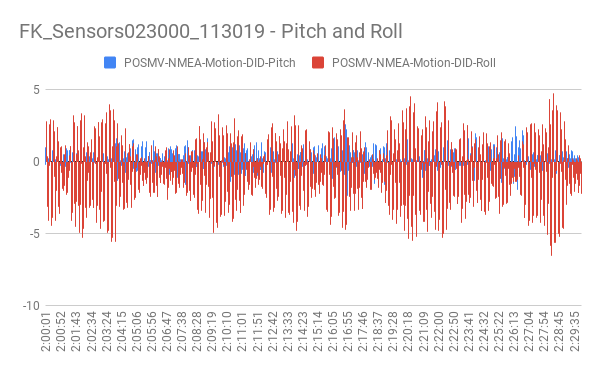
The pitch and roll of the ship are also being scientifically tracked through the Falkor’s extensive system of automated data collection. Using this database, which takes a measurement every second, the same motion represented over time can be represented as a graph.
Motion Sonified
What other methods can we use to depict motion? Translating data into sound – known as “Data Sonification” – can help us understand data by listening. TwoTone is a free web app in which you can upload a spreadsheet of tabular data and use a simple interface to assign an instrument to play the numbers as notes. Using the app as a translation tool, I created an audio depiction of the ship’s motion: the roll of the ship is played as a piano and the pitch is played simultaneously as a harp. You can hear the results below.
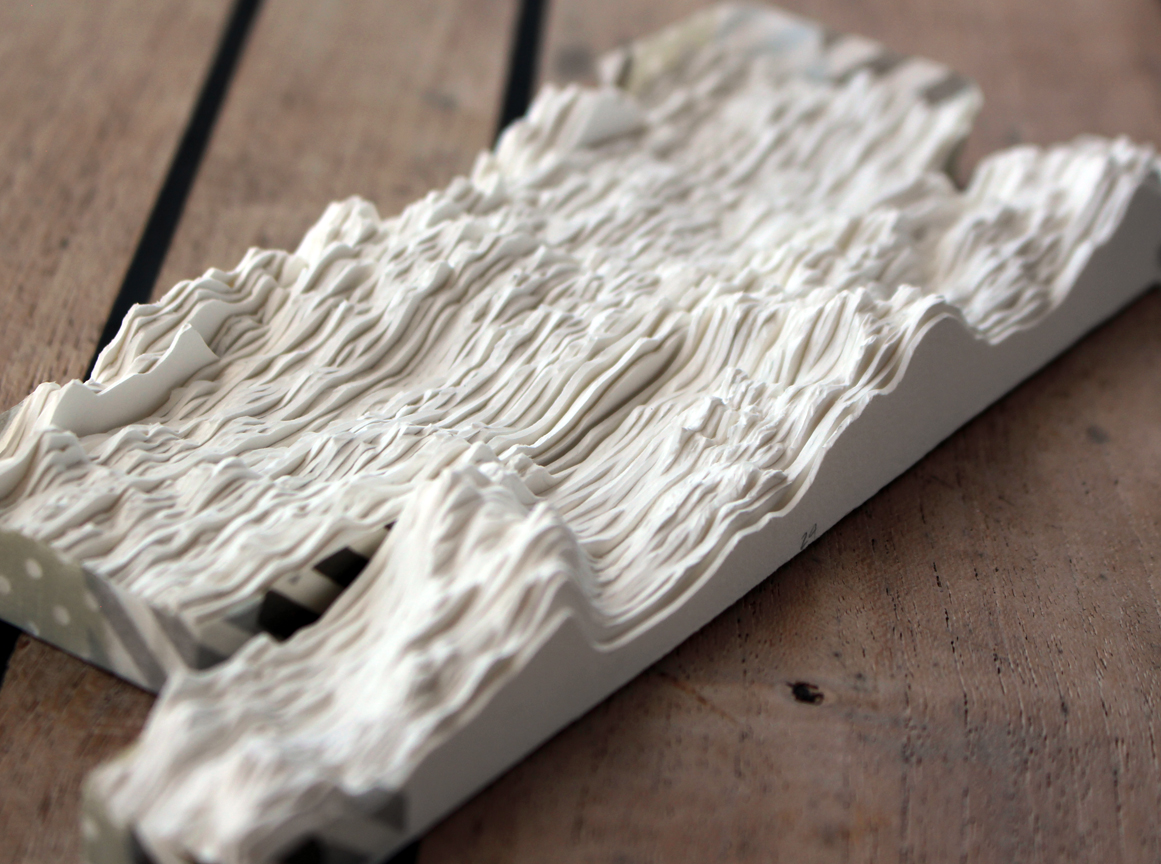
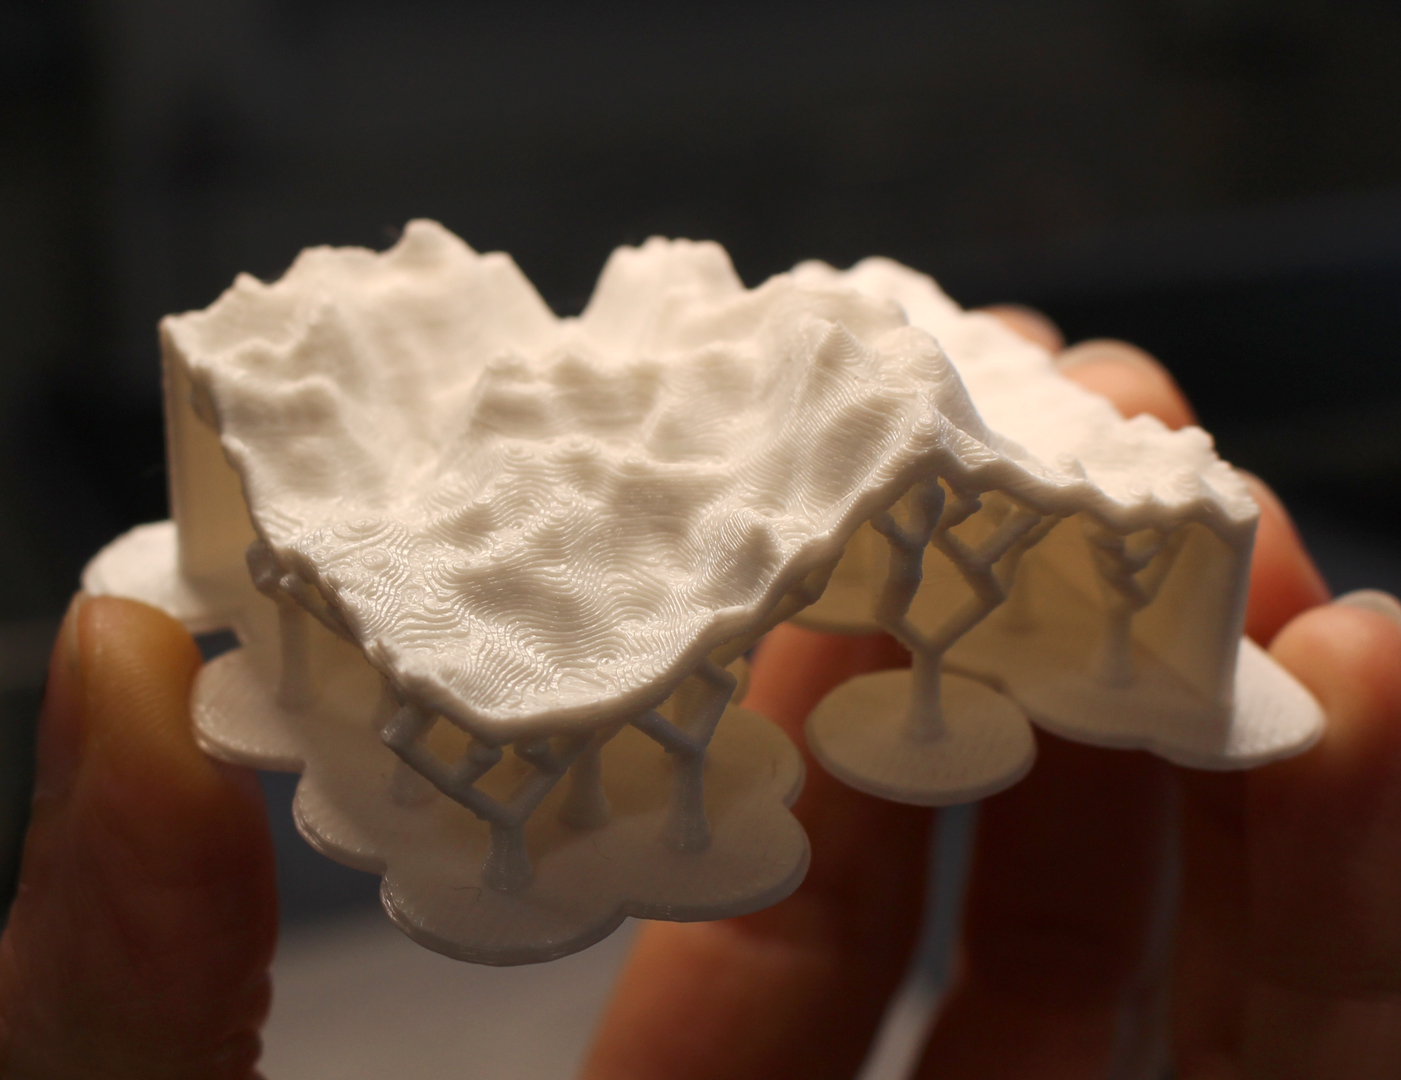
Investigating further as to the cause of the ship’s motion, we arrive at the topic of waves. Nathan Laxague is a Postdoctoral Research Scientist at Lamont-Doherty Earth Observatory of Columbia University and one of the members of the scientific team onboard. Using data on wave motion and slope, I created a three-dimensional model of a sea surface wave using computer aided design (CAD) software. I’ve created two iterations of the surface wave sculpture; one is sliced into layers that are hand cut from paper to be reassembled, and the second is a 3D printed version, both shown below.
What’s Next?
I have only scratched the surface! The scientific team is beginning to analyze data from the UAV mounted infrared camera, and we now have imagery of the Trichodesmium slicks from the air! I am keen to start working with heat map imagery to visualize how these sea slicks are impacting ocean surface heating. Exciting!