World firsts, trichodesmium slicks, exciting deployments, skillful recoveries and a few sharks to boot; the past week or so has flown by (quite literally). With so much action packed into such a short period of time, we have to remind ourselves that there are still a few weeks to go! As we begin week two, we take a look back at what the Air-to-Sea team and the crew of the R/V Falkor have been up to.
Departing Suva on the 20th of November, we sailed through the night to the northwest of Fiji (16° 0′ 14.76″ S, 176° 47′ 40.2″ E). These waters are known as some of the calmest in the world; an ideal location to look for Trichodesmium. Trichodesmium (or Tricho as it is affectionately referred to by the science team) is a genus of filamentous cyanobacteria, a type of algae.
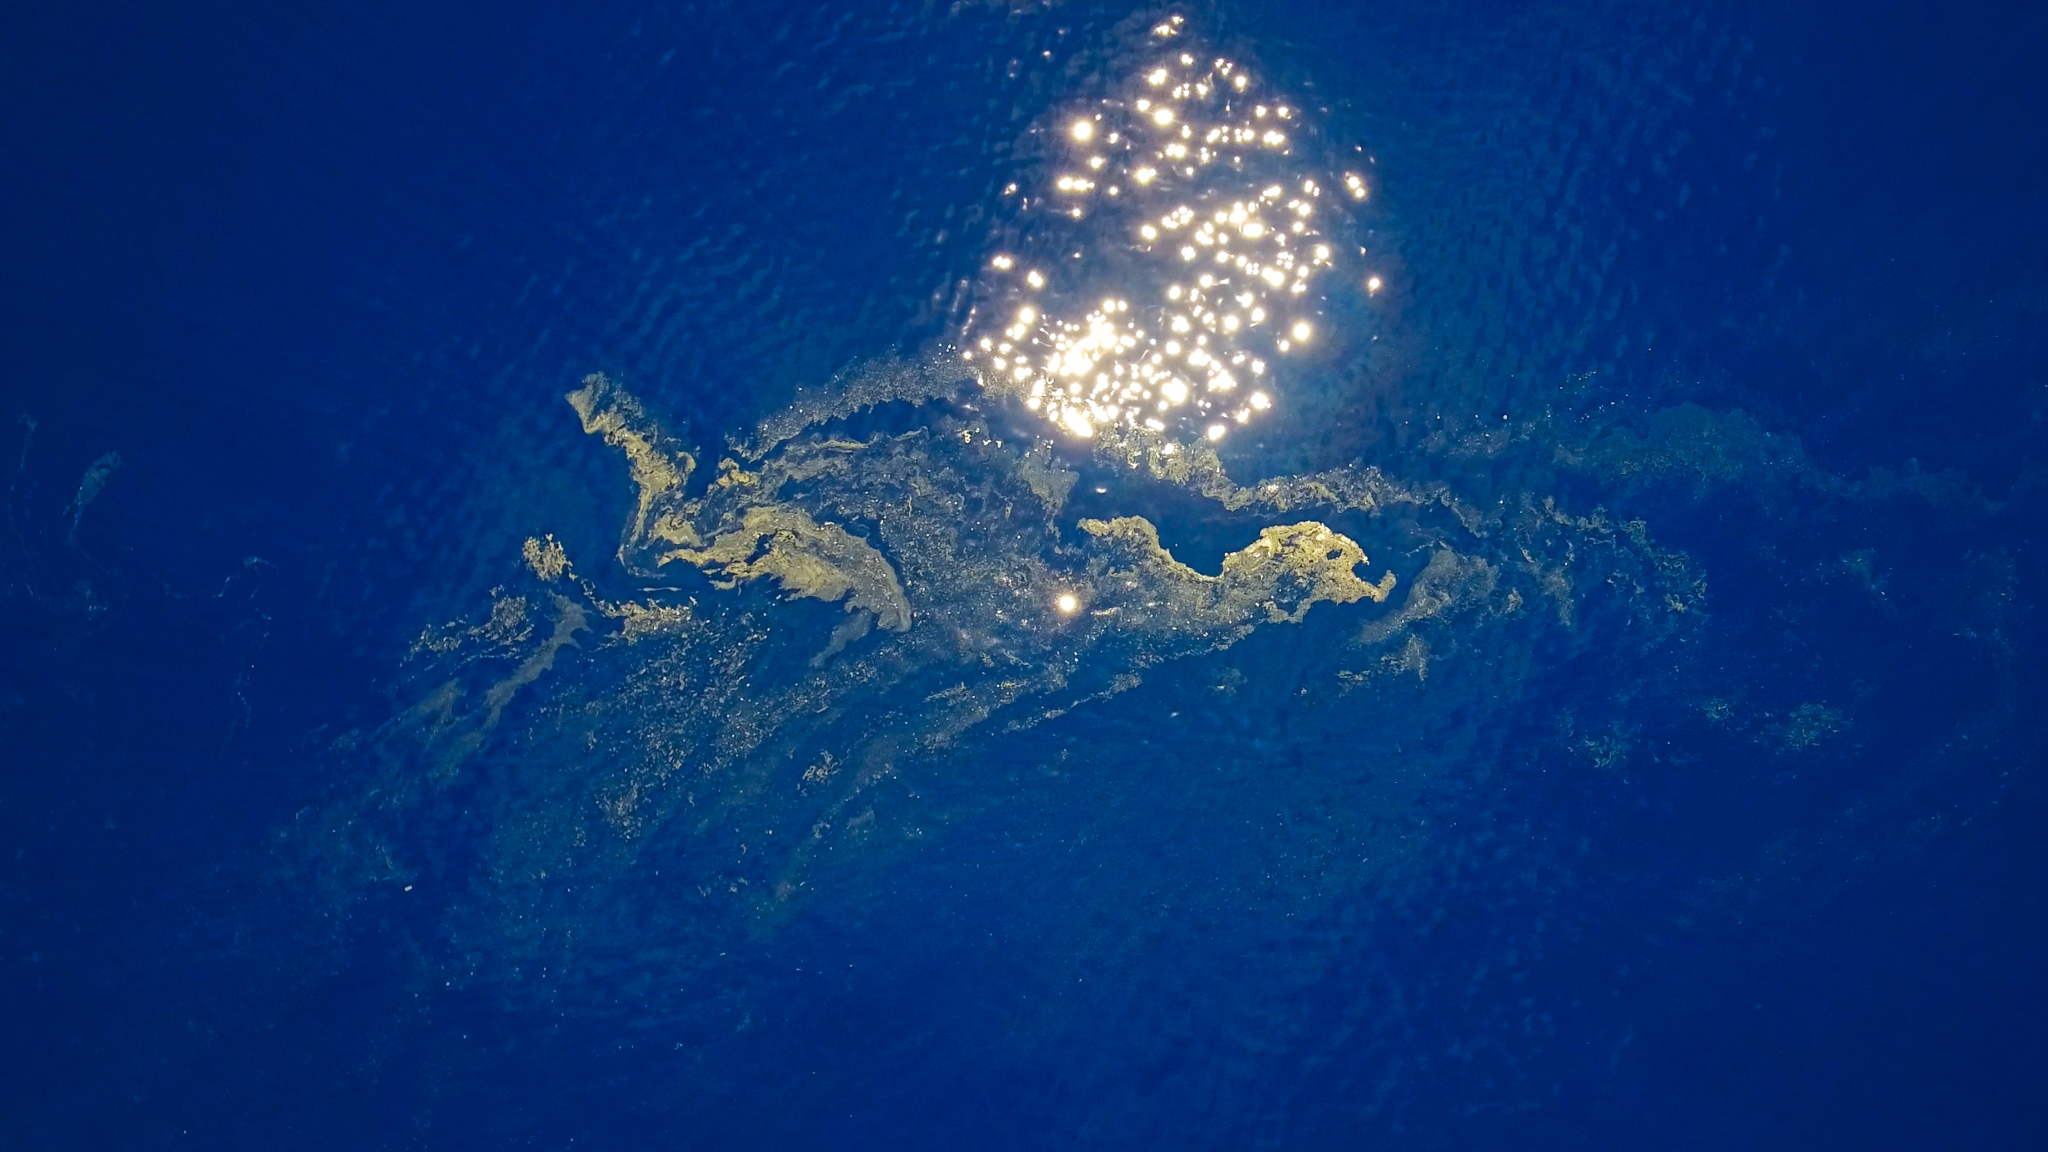
Growing on such a scale that they can be seen from satellites, these slicks can cover areas of 200,000 km2 and are the subject of the biggest questions of this cruise. The most crucial being whether these wide-spreading slicks of Trichodesmium at the surface warm the water by light and heat absorption, or, conversely whether they cool the surface through reflection. By deploying an array of instruments, vehicles and sensors during this cruise, the goals are to improve our understanding of these processes, to further our ability to more accurately predict weather patterns and to understand the impacts on large scale processes such as ocean circulation and the hydrological cycle.
Trich Tracking Timetable
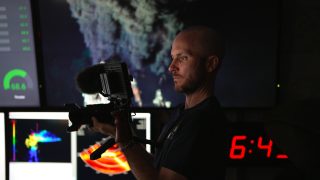
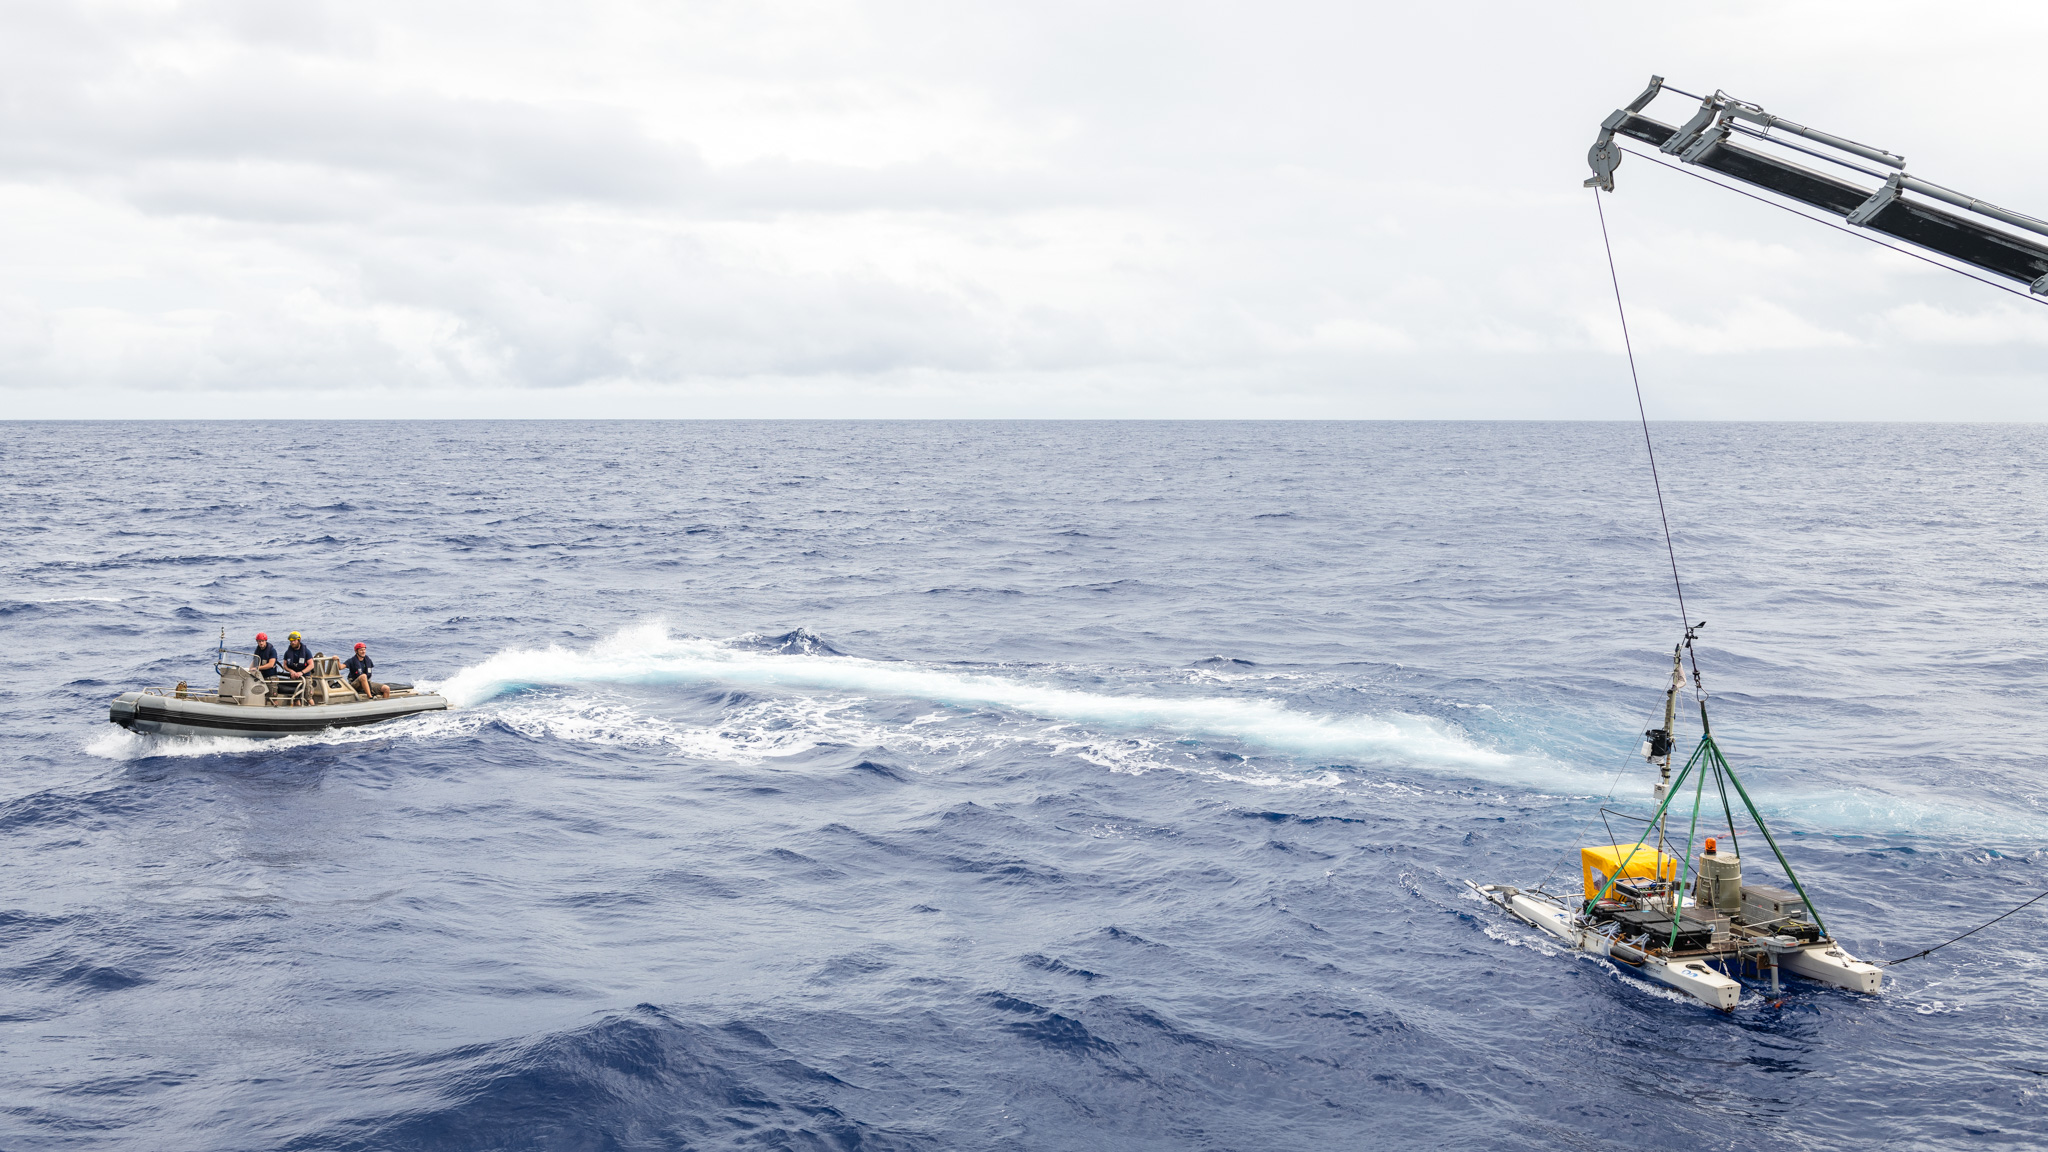
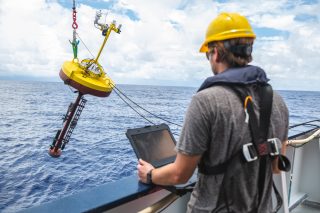
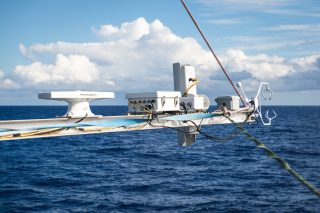
Light plays an integral part in much of this cruise’s data collection, and so the team are making the most of those precious daylight hours. One moment, the UAVs (Unmanned Aerial Vehicles) are taking off, the next the Catamaran is being deployed and Atreyu (the small boat) is out in the water to assist. At the bow of the ship, the Bow Flux Boom is being extended, while at the stern the buoys, SPIP (Surface Processes Instrument Platform), and Sniffle are deployed. The schedule is relentless, but the data promises to be fascinating.
The combination of all the equipment being used on the cruise is providing high resolution data on ocean temperature, color, currents, wave patterns, salinity and more, as well as collecting water samples which, amongst other things, contain Trichodesmium. Every measurement and sample is cross referenced and corroborated by complimentary data collected by another piece of technology – whether that is a UAV, an autonomous buoy, a remotely piloted catamaran, or the Falkor’s own CTD (Conductivity, Temperature, and Depth
Profiler).
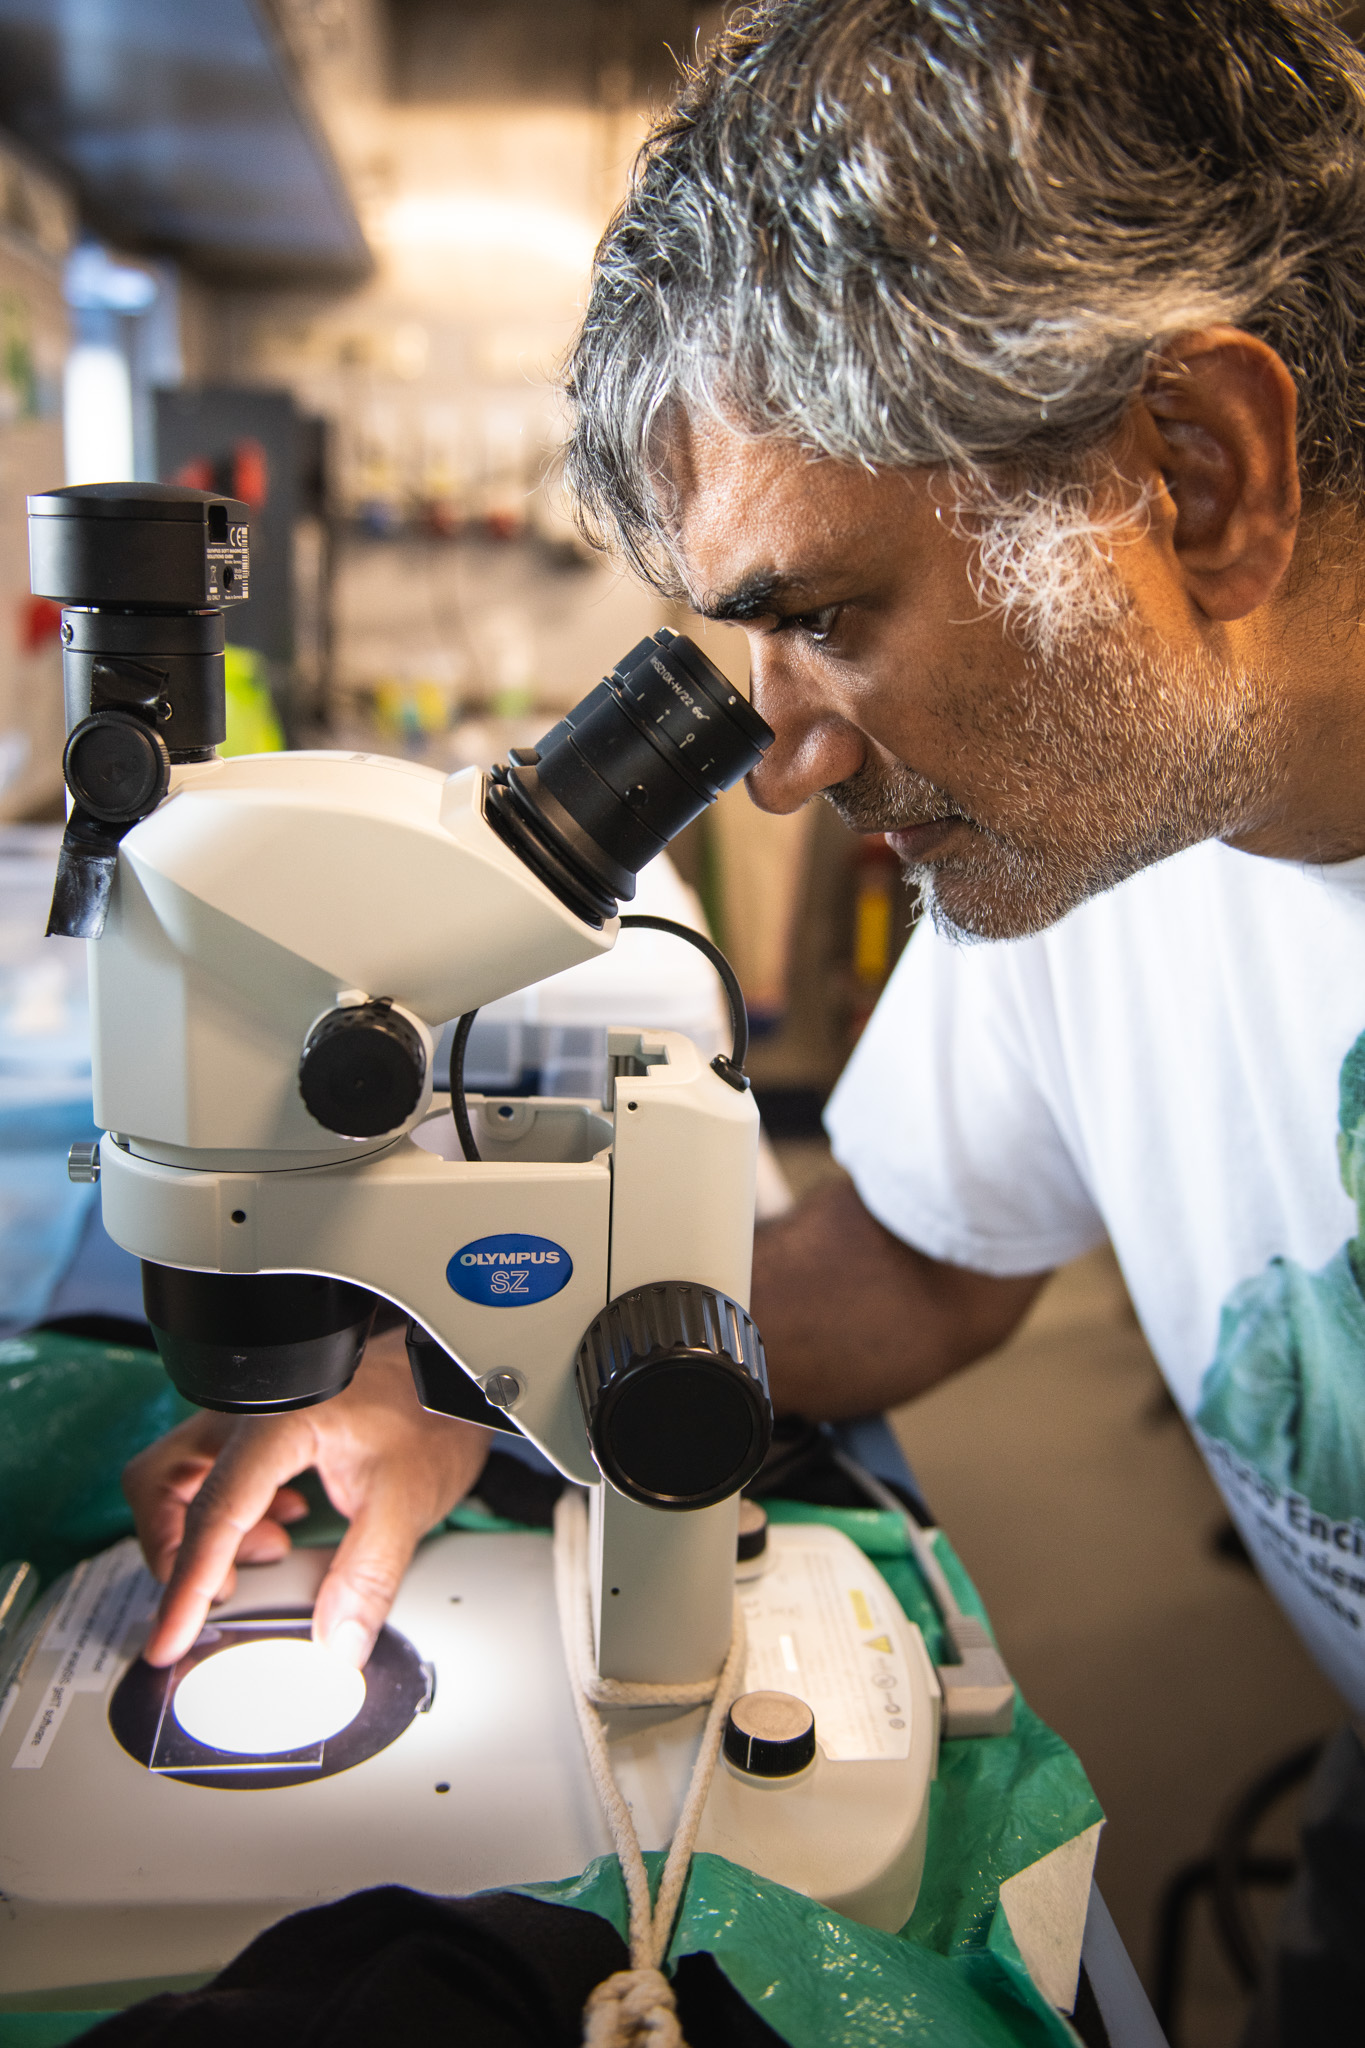
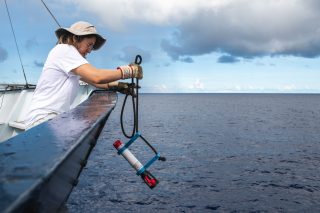
Not everything requires winches, cables, small boats, and complicated procedures for deployment however. From portable app-connected CTDs, to hyperspectral and multispectral radiometers all deployed by hand – on this expedition, the equipment comes in all shapes and sizes.
Seeing Beyond the Horizon
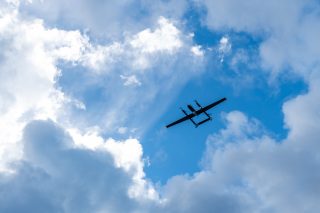
The Air-to-Sea team have already made some fantastic achievements, including a significant milestone in unmanned aerial systems (UAS) flight. The first successful, fully-autonomous deployment and recovery of a hybrid-VTOL fixed wing UAV from a moving ship on the open ocean was completed on November 21st from Falkor. Fully-autonomous describes no manual piloting of the aircraft, with take-off, flight and landing completely operated by the
UAS ground station.

In addition to this, we have discovered expansive areas of the ocean surface covered in Trichodesmium and corroborated this with in-situ measurements and local spectral radiometry. We have been able to map the region using UAV (Unmanned Aerial Vehicle) systems with hyperspectral imaging to quantify the ocean color associated with Trichodesmium compared to deep-blue open ocean. The science team have also been able to send all UAV data back to Falkor in real-time during flight to allow them to target ocean surface features of interest like Trichodesmium slicks. Prior to this development, UAVs were sent out blind, aiming to map the correct area based on satellite data, which was often cloud covered and from previous days. Now, the UAVs (with high bandwidth data telemetry) allow the Air-to-Sea team to have eyes over the horizon, assessing and updating flight plans in real-time based on ocean surface imagery being beamed to the ship live. This technique is a very efficient use of time and resources; it is a extraordinarily productive and effective way to do science.

All in all, it has been an extremely successful start to the cruise. Within our first week we have pushed boundaries, set new records, and are now operating with two aircraft flying simultaneously. Alongside the UAVs, we have data pouring in from buoys, the catamaran, our handheld instruments as well as all the other technology being utilized on this cruise. So far this amounts to over 5,000 GB! The result is an incredibly detailed dataset that will revolutionize the way we interpret satellite imagery and will yield a deeper understanding of global oceanographic processes.