The crow’s nest: For the longest time, the best we could do to observe the ocean at any distance from a ship was to climb up a mast and look. Since the advent of hobbyist unmanned aerial vehicle (UAVs more commonly known as “drones”) in the last five years, scientists have used small, lightweight robotics equipped with cameras to buzz around a ship and take photos. But in order to make scientifically relevant measurements with high accuracy, we need aircraft that can lift heavier payloads, fly longer distances, reach higher heights, and operate under conditions typically found in the oceans – such as windy with waves that make the ship an unstable platform that is constantly moving – and we need them to do this safely, over and over again.
Why Do We Study the Ocean?
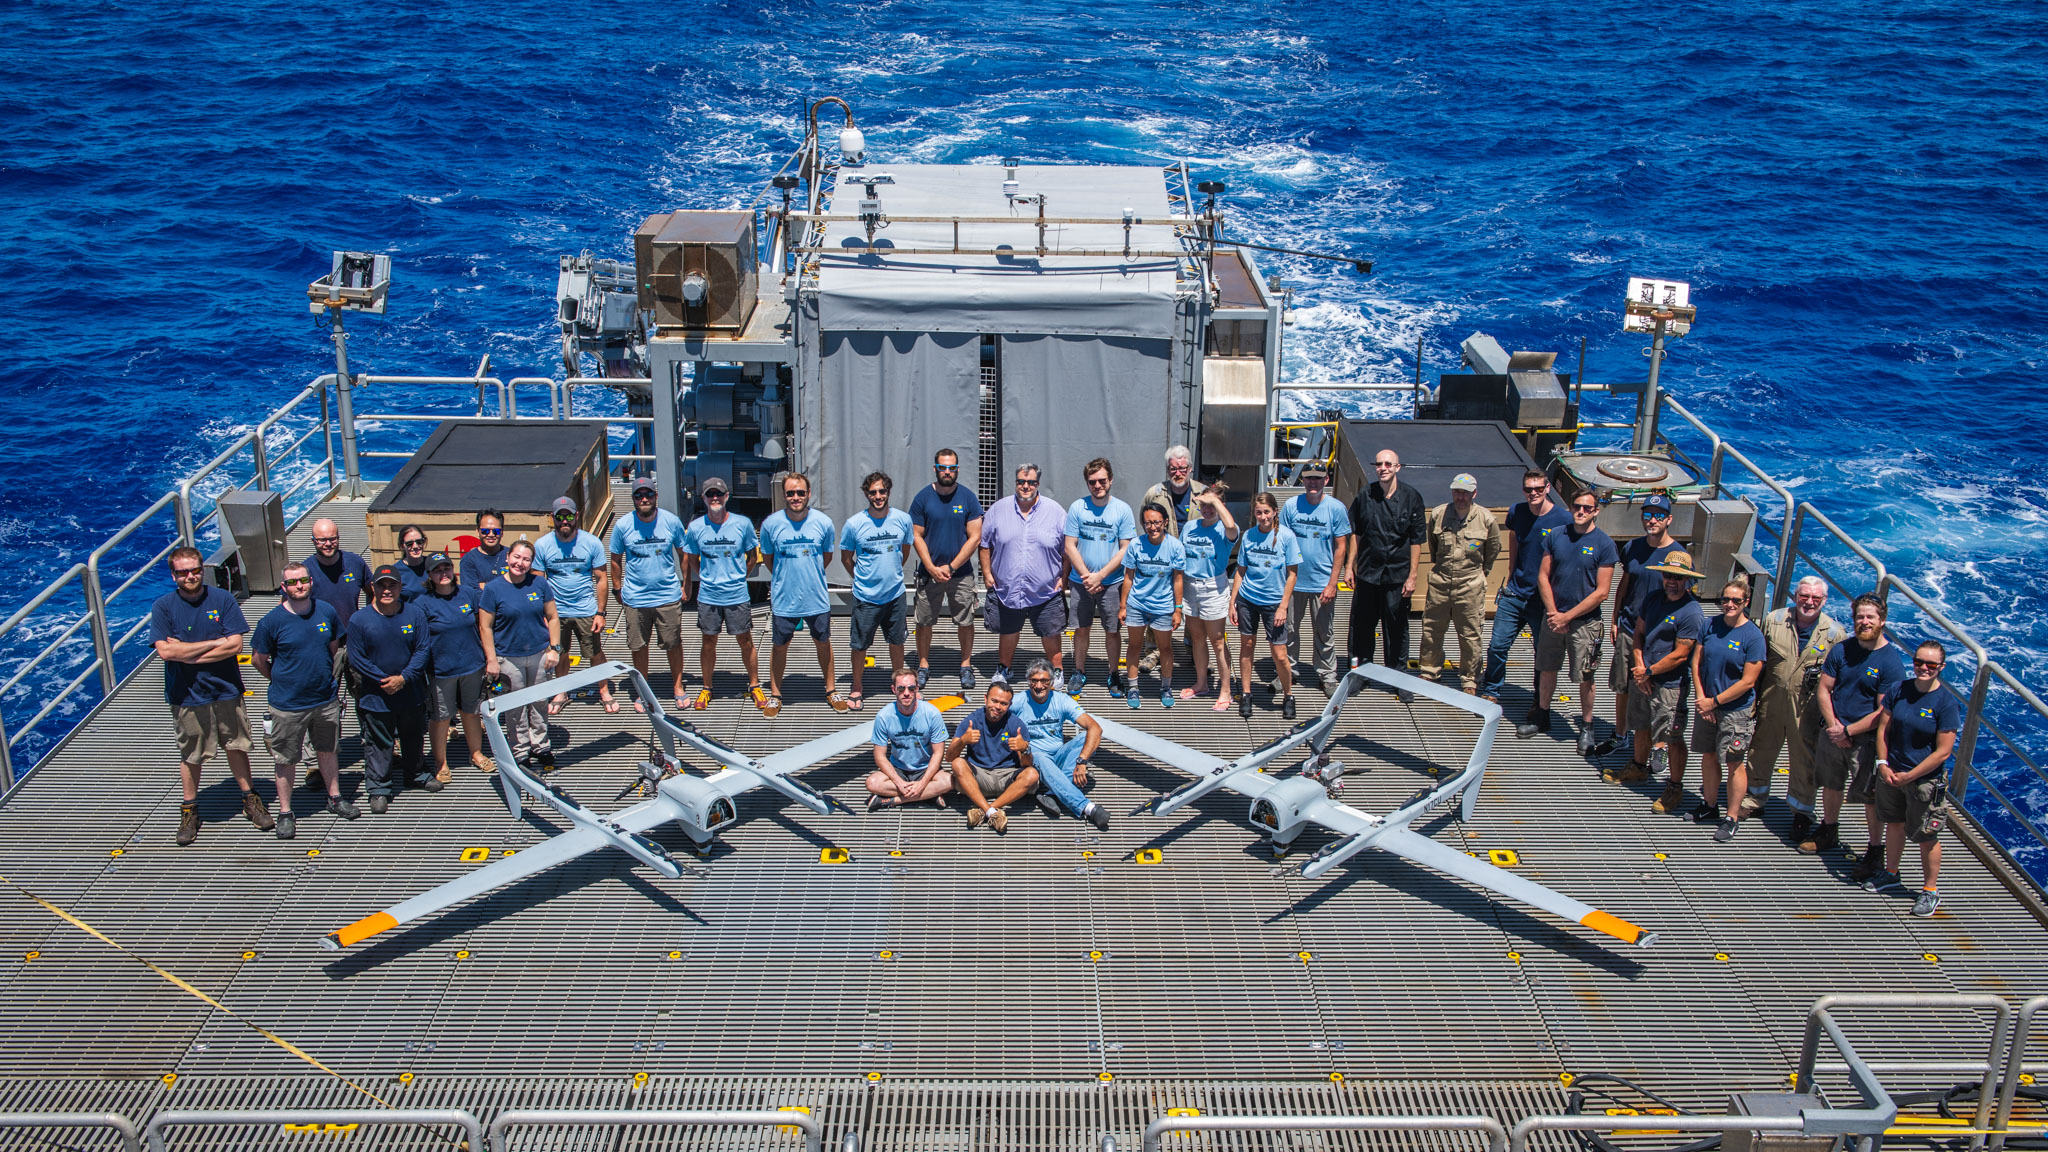
Using highly accurate sensors on the ship and the aircraft, we designed a system that controlled the aircraft’s takeoff and touchdown autonomously with a precision unmatched by human hands. We developed payloads with miniaturized sensors to map the temperature and color of the ocean surface in high spectral accuracy, providing us images with a resolution of centimeters. Over a period of five weeks, we flew three aircraft with four different payloads, studying the surface skin layer of the ocean for over 240 hours, collecting over 43 TB of data, and covering a distance of more than 19,000 km – quite a bit more than the distance of New York to Singapore!
Why do we study the ocean? Simply put, the ocean is what makes this planet habitable: oceans provide half the oxygen we breathe through photosynthesis by phytoplankton, the tiny single cell organisms that live in the ocean. Phytoplankton also form the base of the food web in the ocean, thus feeding the fish we catch. Oceans regulate weather by absorbing (or giving off heat) – for example, controlling how and where a hurricane might go. Oceans regulate climate: CO₂ a potent greenhouse gas, is absorbed by the ocean and stored for centuries to millennia. Oceans are changing rapidly due to human activities, and it is critical for us to understand how the surface skin layer, through which all the gas and energy exchange with the atmosphere happens.
10 Years in the Making
We embarked on this voyage with multiple technological and scientific objectives: to demonstrate autonomous operations of a hybrid-VTOL fixed wing UAV; to demonstrate the utility of real-time data feeds from the aircraft; to demonstrate that we can make adjustments flight plans in response to what we see in the real-time data and thus map features of interest; to use these platforms and deploying bespoke payloads to make measurements of the ocean surface with unprecedented accuracy and resolution. Our original object was to study the enigmatic organism Trichodesmium – a globally relevant and biogeochemically significant cyanobacteria that “blooms” in tropical waters and forms slicks that can cover 100’s of square kilometers. We wanted to know how these slicks affected the exchange of gases and energy between the atmosphere and the ocean. Serendipitously, an underwater volcanic that had erupted in August created a rubble field of floating pumice larger than the size of Manhattan – this feature was detected in satellite imagery. Over the next three months, the pumice broke up and scattered, becoming no longer visible via remote sensing. These pumice rafts also could possibly alter the absorption of heat by the oceans, so we decided to try and find the remnants of the pumice, examine if this was true, and investigate how much of an effect there was.

Exceeding Expectations and Pushing Boundaries
We exceeded our expectations on this cruise: we discovered large rafts of pumice floating on the ocean surface and discovered enormous blooms of Trichodesmium that extend kilometers into the horizon. Both of these pumice and Trichodesmium patches showed clear evidence of near-surface heating patterns of the ocean.
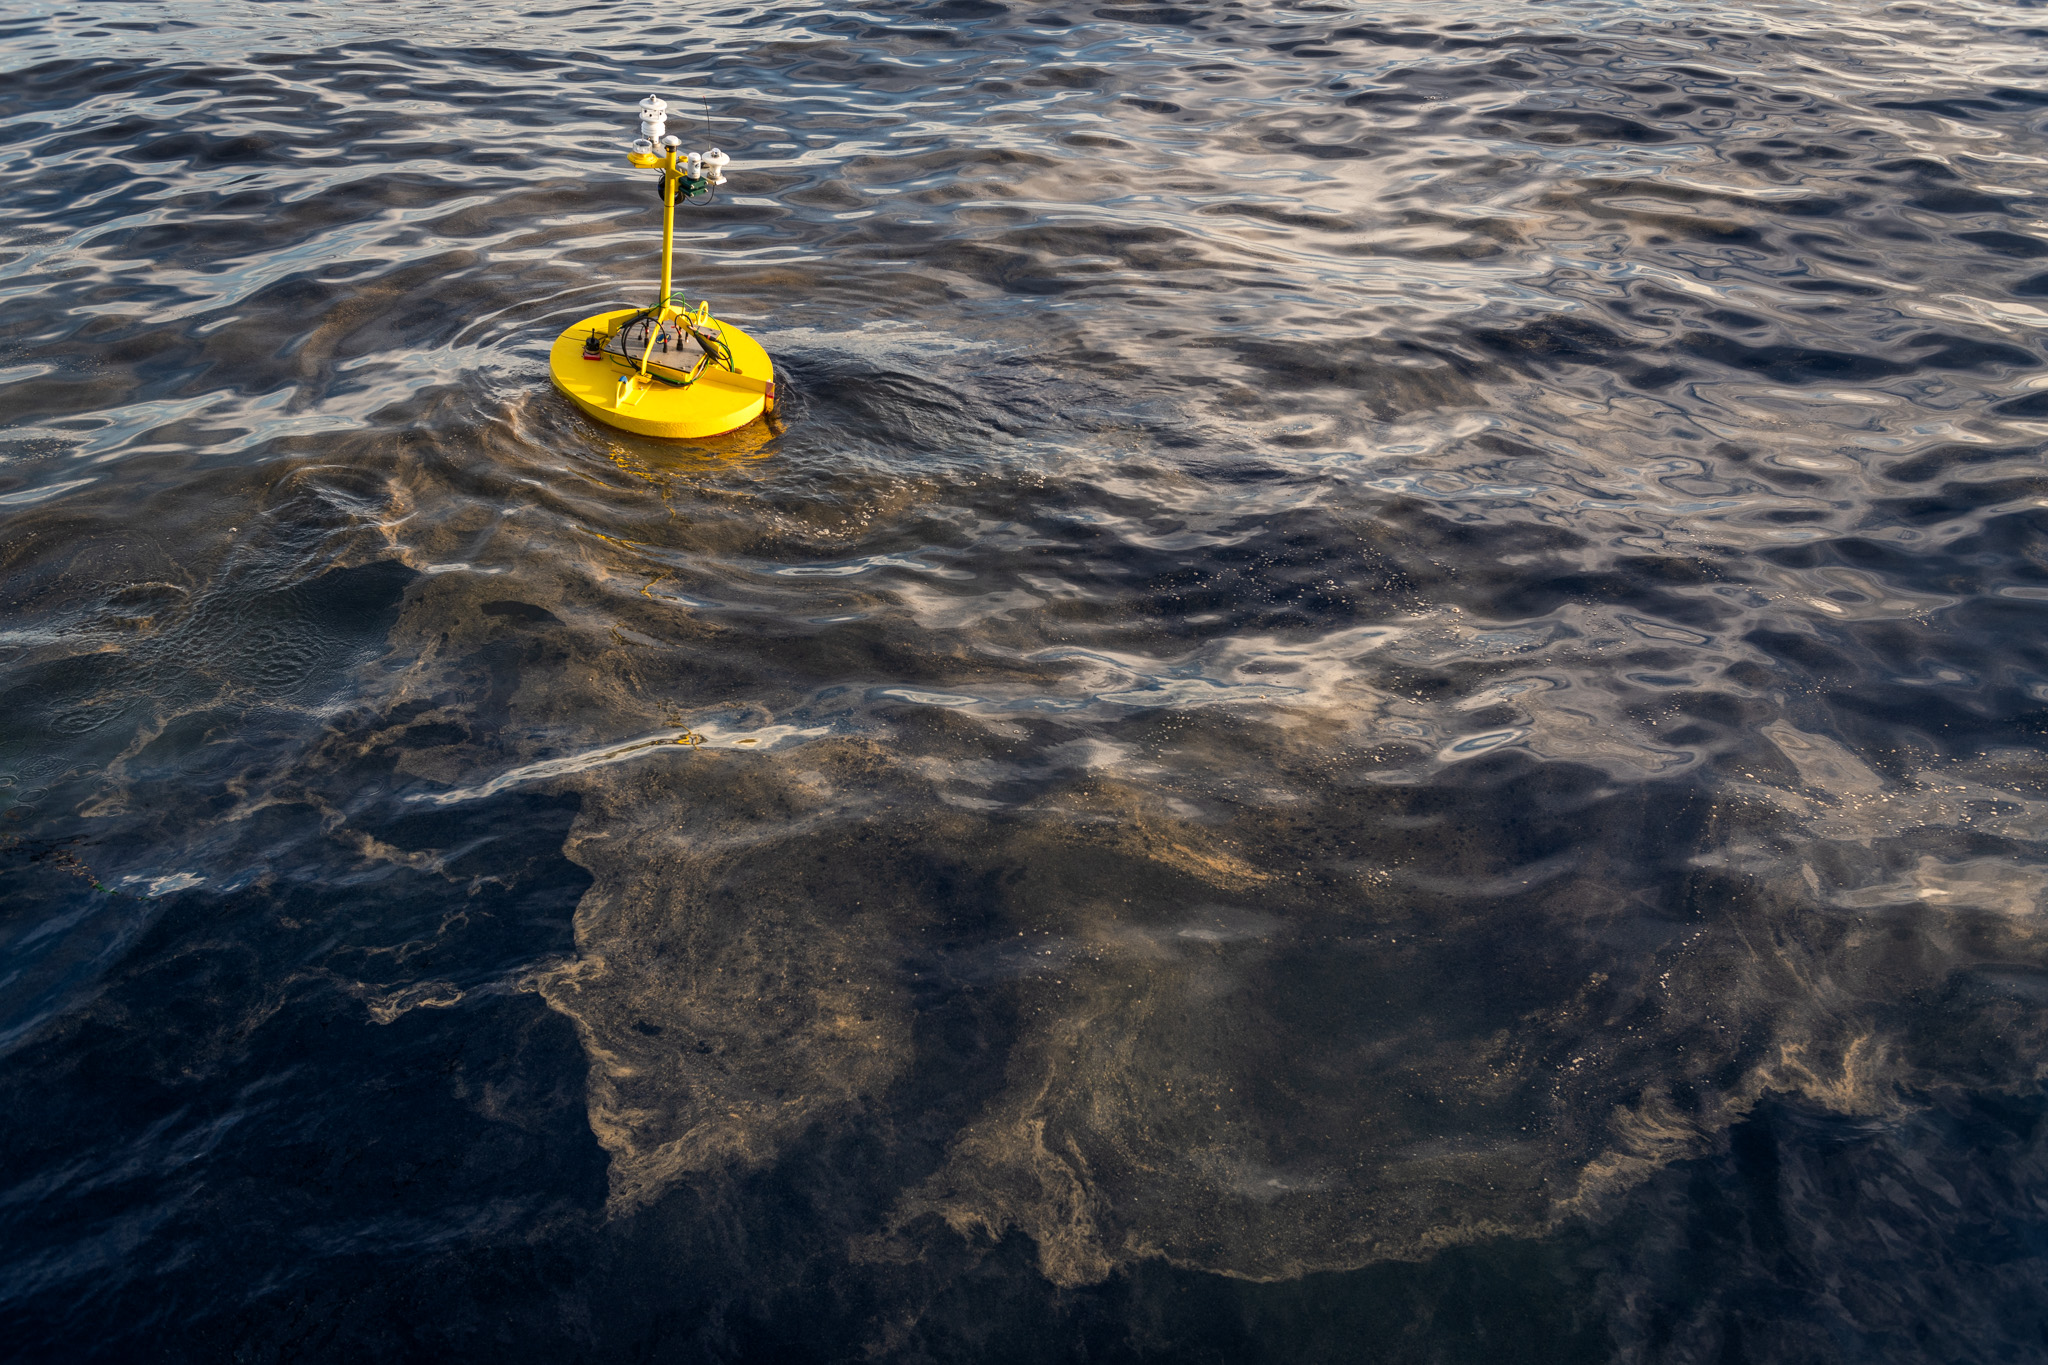
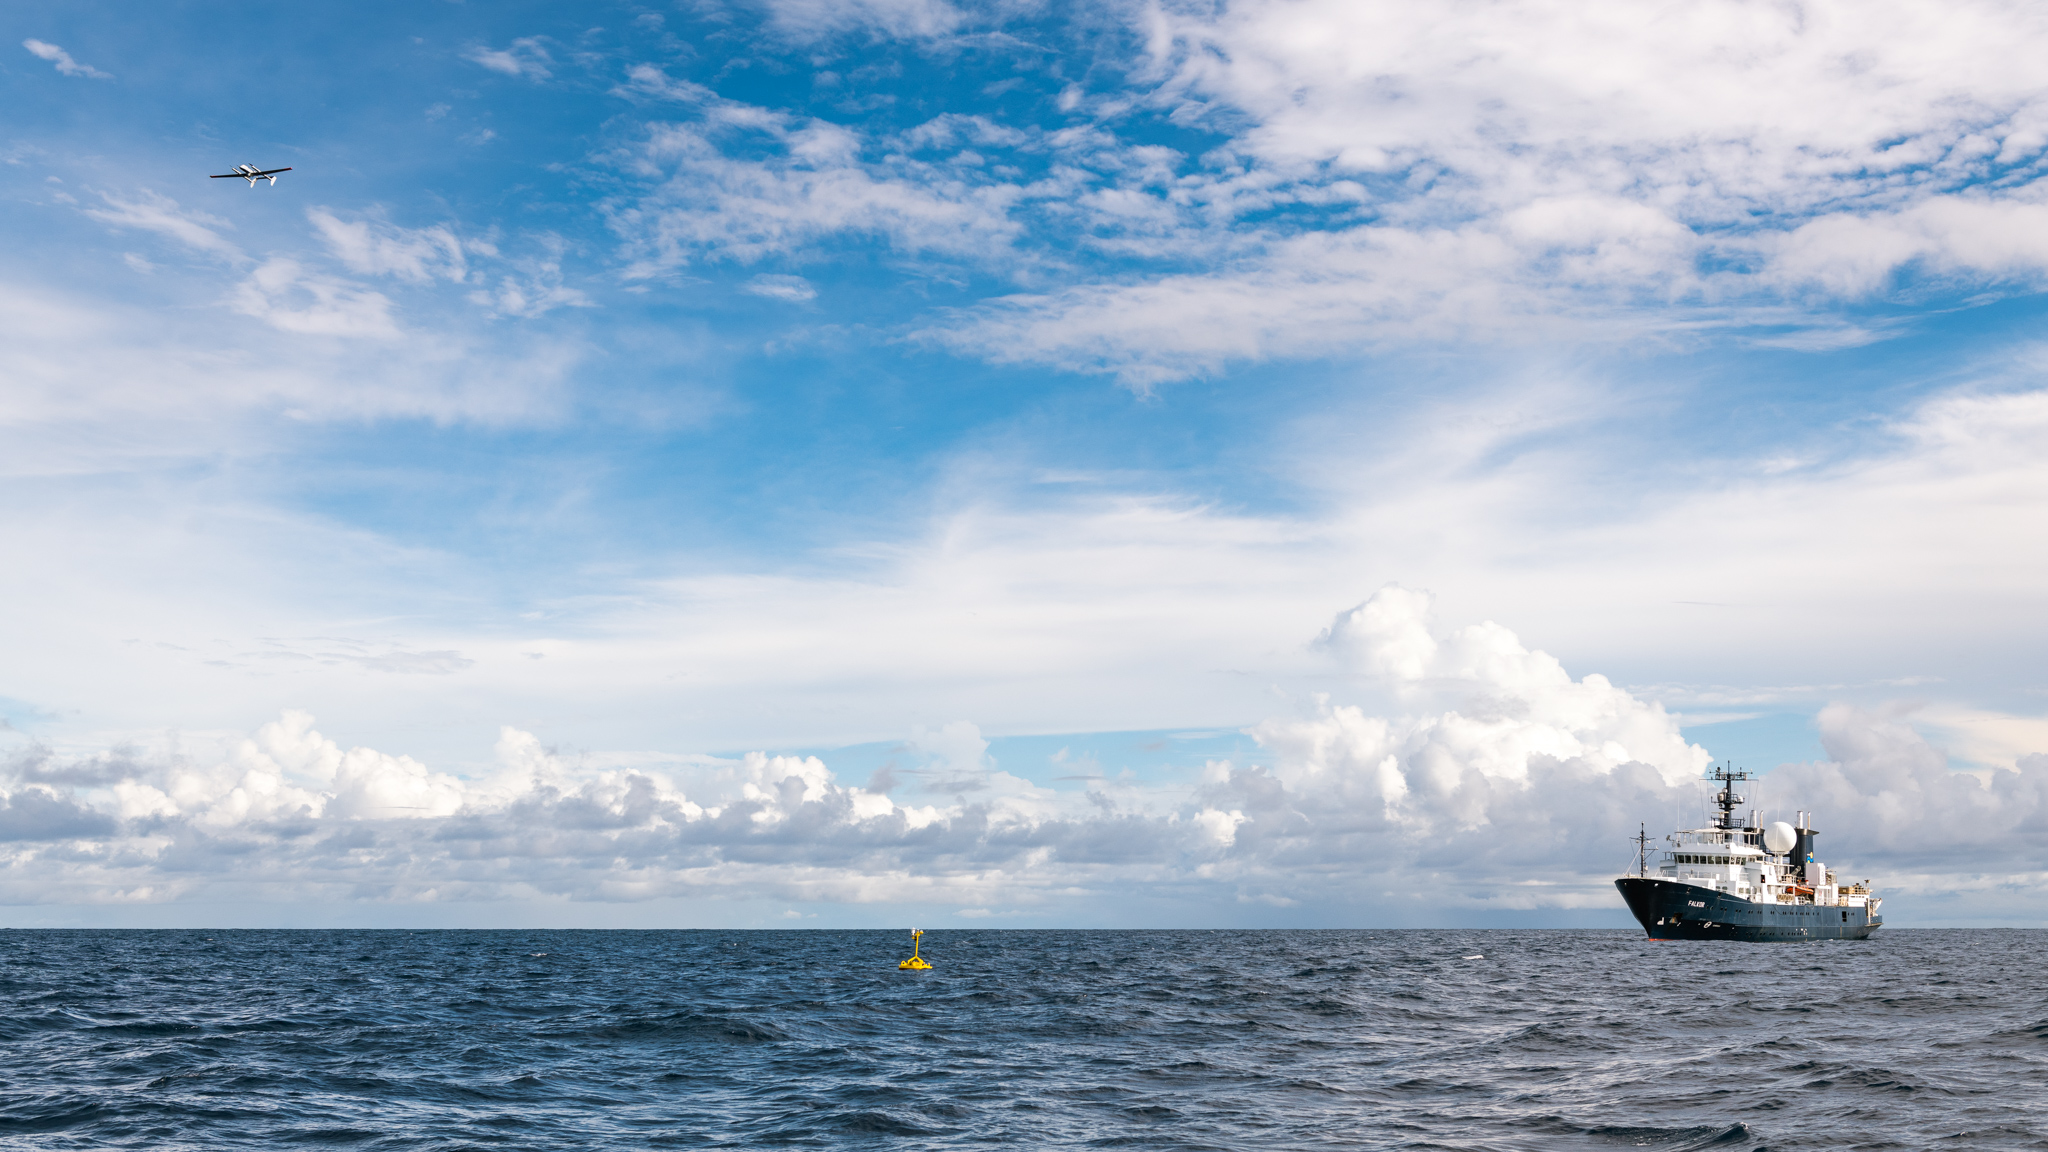
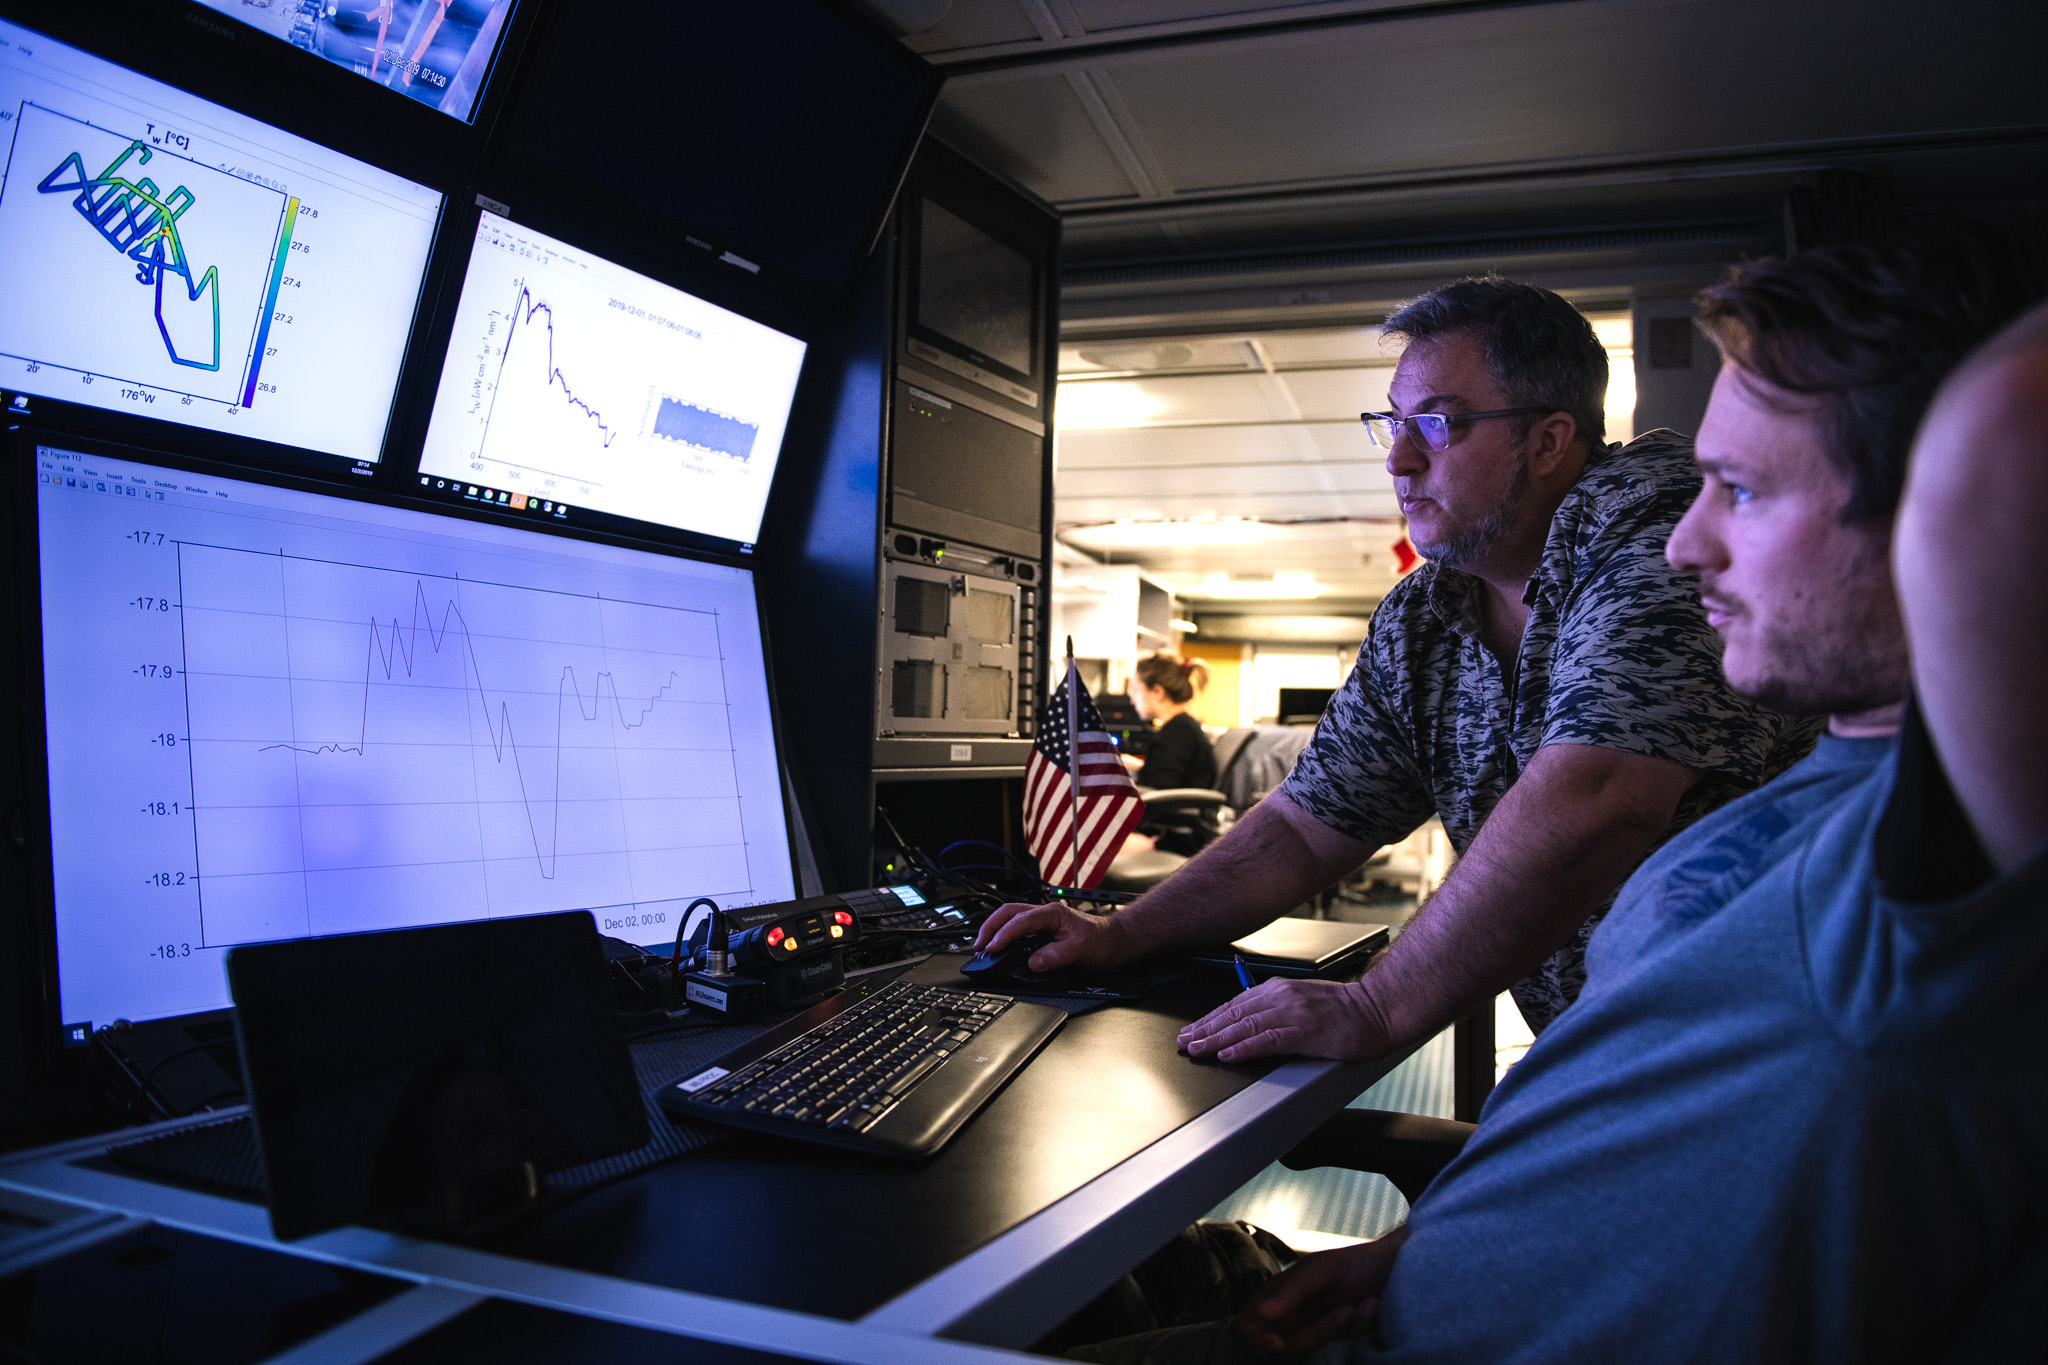
On this voyage, we perfected the ability to use UAVs as our eyes beyond the horizon, exploring the ocean beyond what we could see from the ship. We are now able to discover, identify, and track features in ways which have never been done before, and in extraordinary detail. Previously, we would send the UAVs out and hope to see something. Now, we have real-time data telemetry that allows us to react at a moment’s notice. We are able to re-task our UAV flight missions to map the feature of interest in incredible detail. The UAVs afford us the agility to direct R/V Falkor to go exactly where needed in order to deploy surface floating buoys (the SPIP and the Sniffle). We were able to deploy an autonomous surface vehicle, the Catamaran, to make transects across features of interest, and remotely collect samples of the surface microlayer for analysis back in the laboratory.
Our biggest challenge is yet to come: analyzing the ~43 TB of data collected from all the instruments used on this cruise, and discover how the ocean is changing on a multitude of spatial and temporal scales. These same technological advances will be used on future research cruises to understand a multitude of pressing and urgent concern, such as: How do the processes changing the Arctic sea ice work? How will that impact indigenous communities, ocean circulation patterns, climate, and weather? How will changes in ocean heat and carbon-uptake impact marine food webs, threaten fisheries, and amplify hurricane severity? How heat will be transported to Earth’s polar regions, thereby triggering global climate shifts and accelerating changes to the Greenland and Antarctic ice sheets, melting ice, and raising sea levels? These discoveries will lead to a better understanding of how the ocean will react to a changing climate, how the ocean’s ecosystem adapt to such change, and ultimately, how humankind can better prepare for its future on this planet.