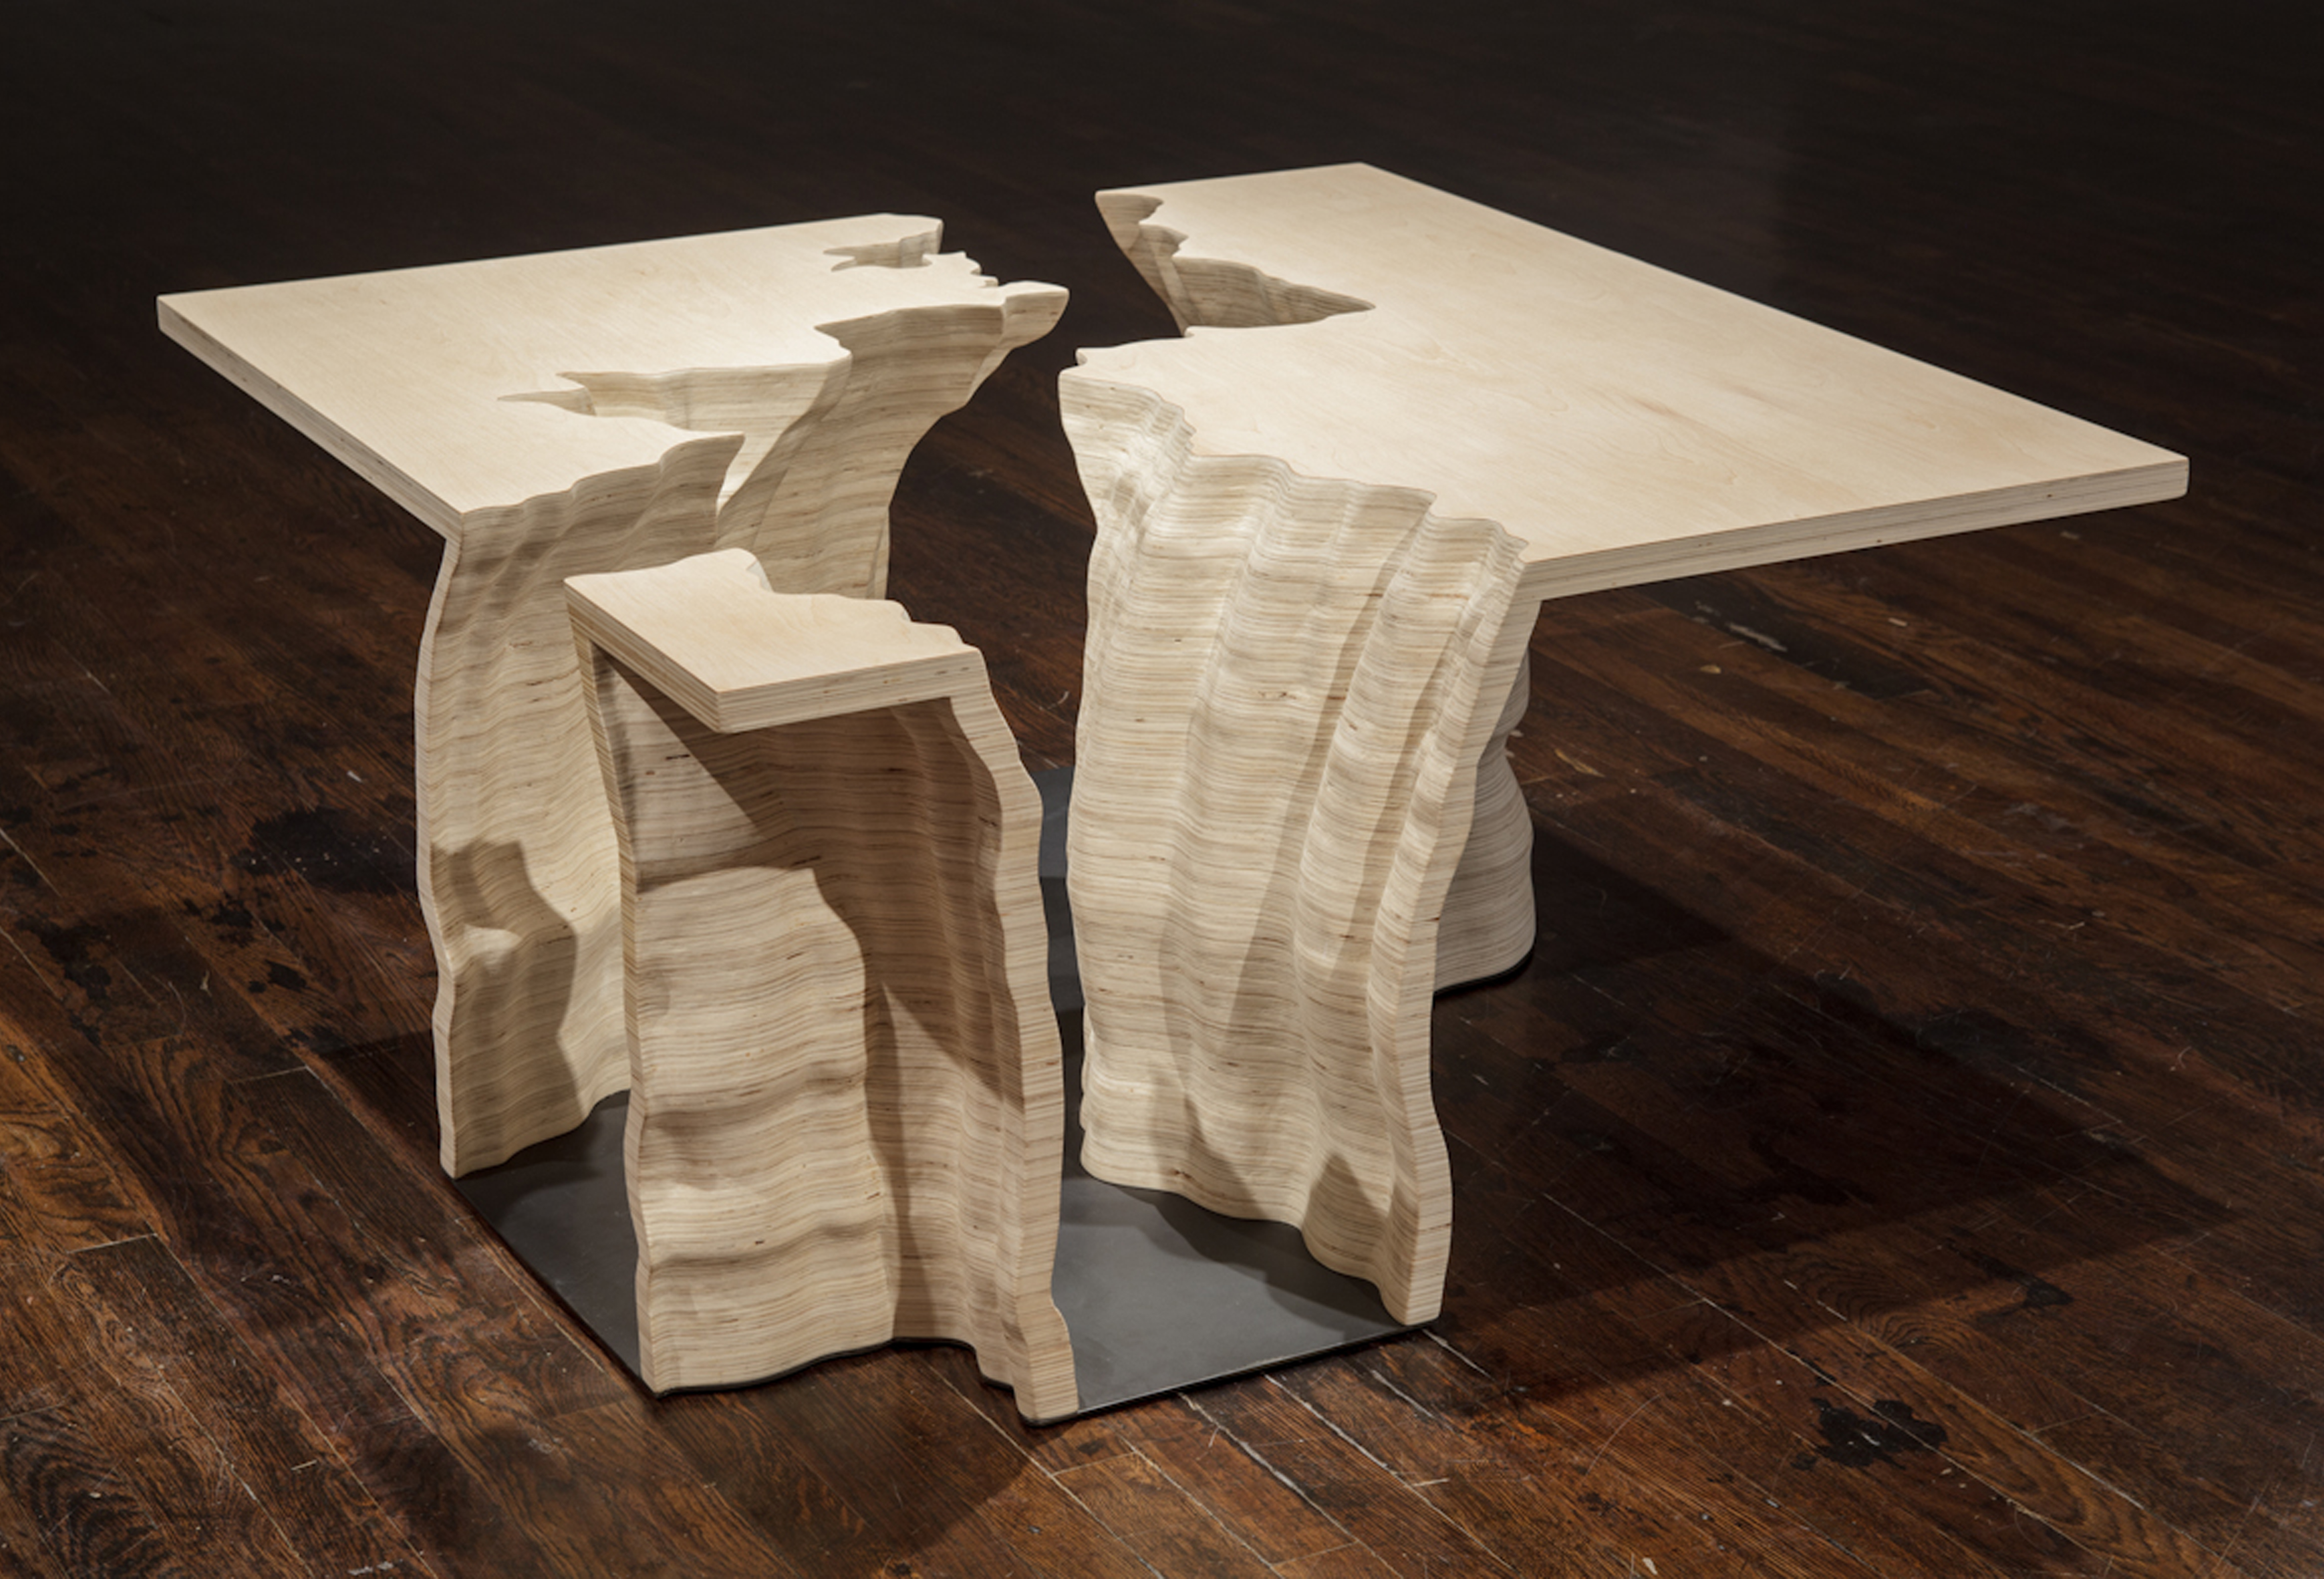
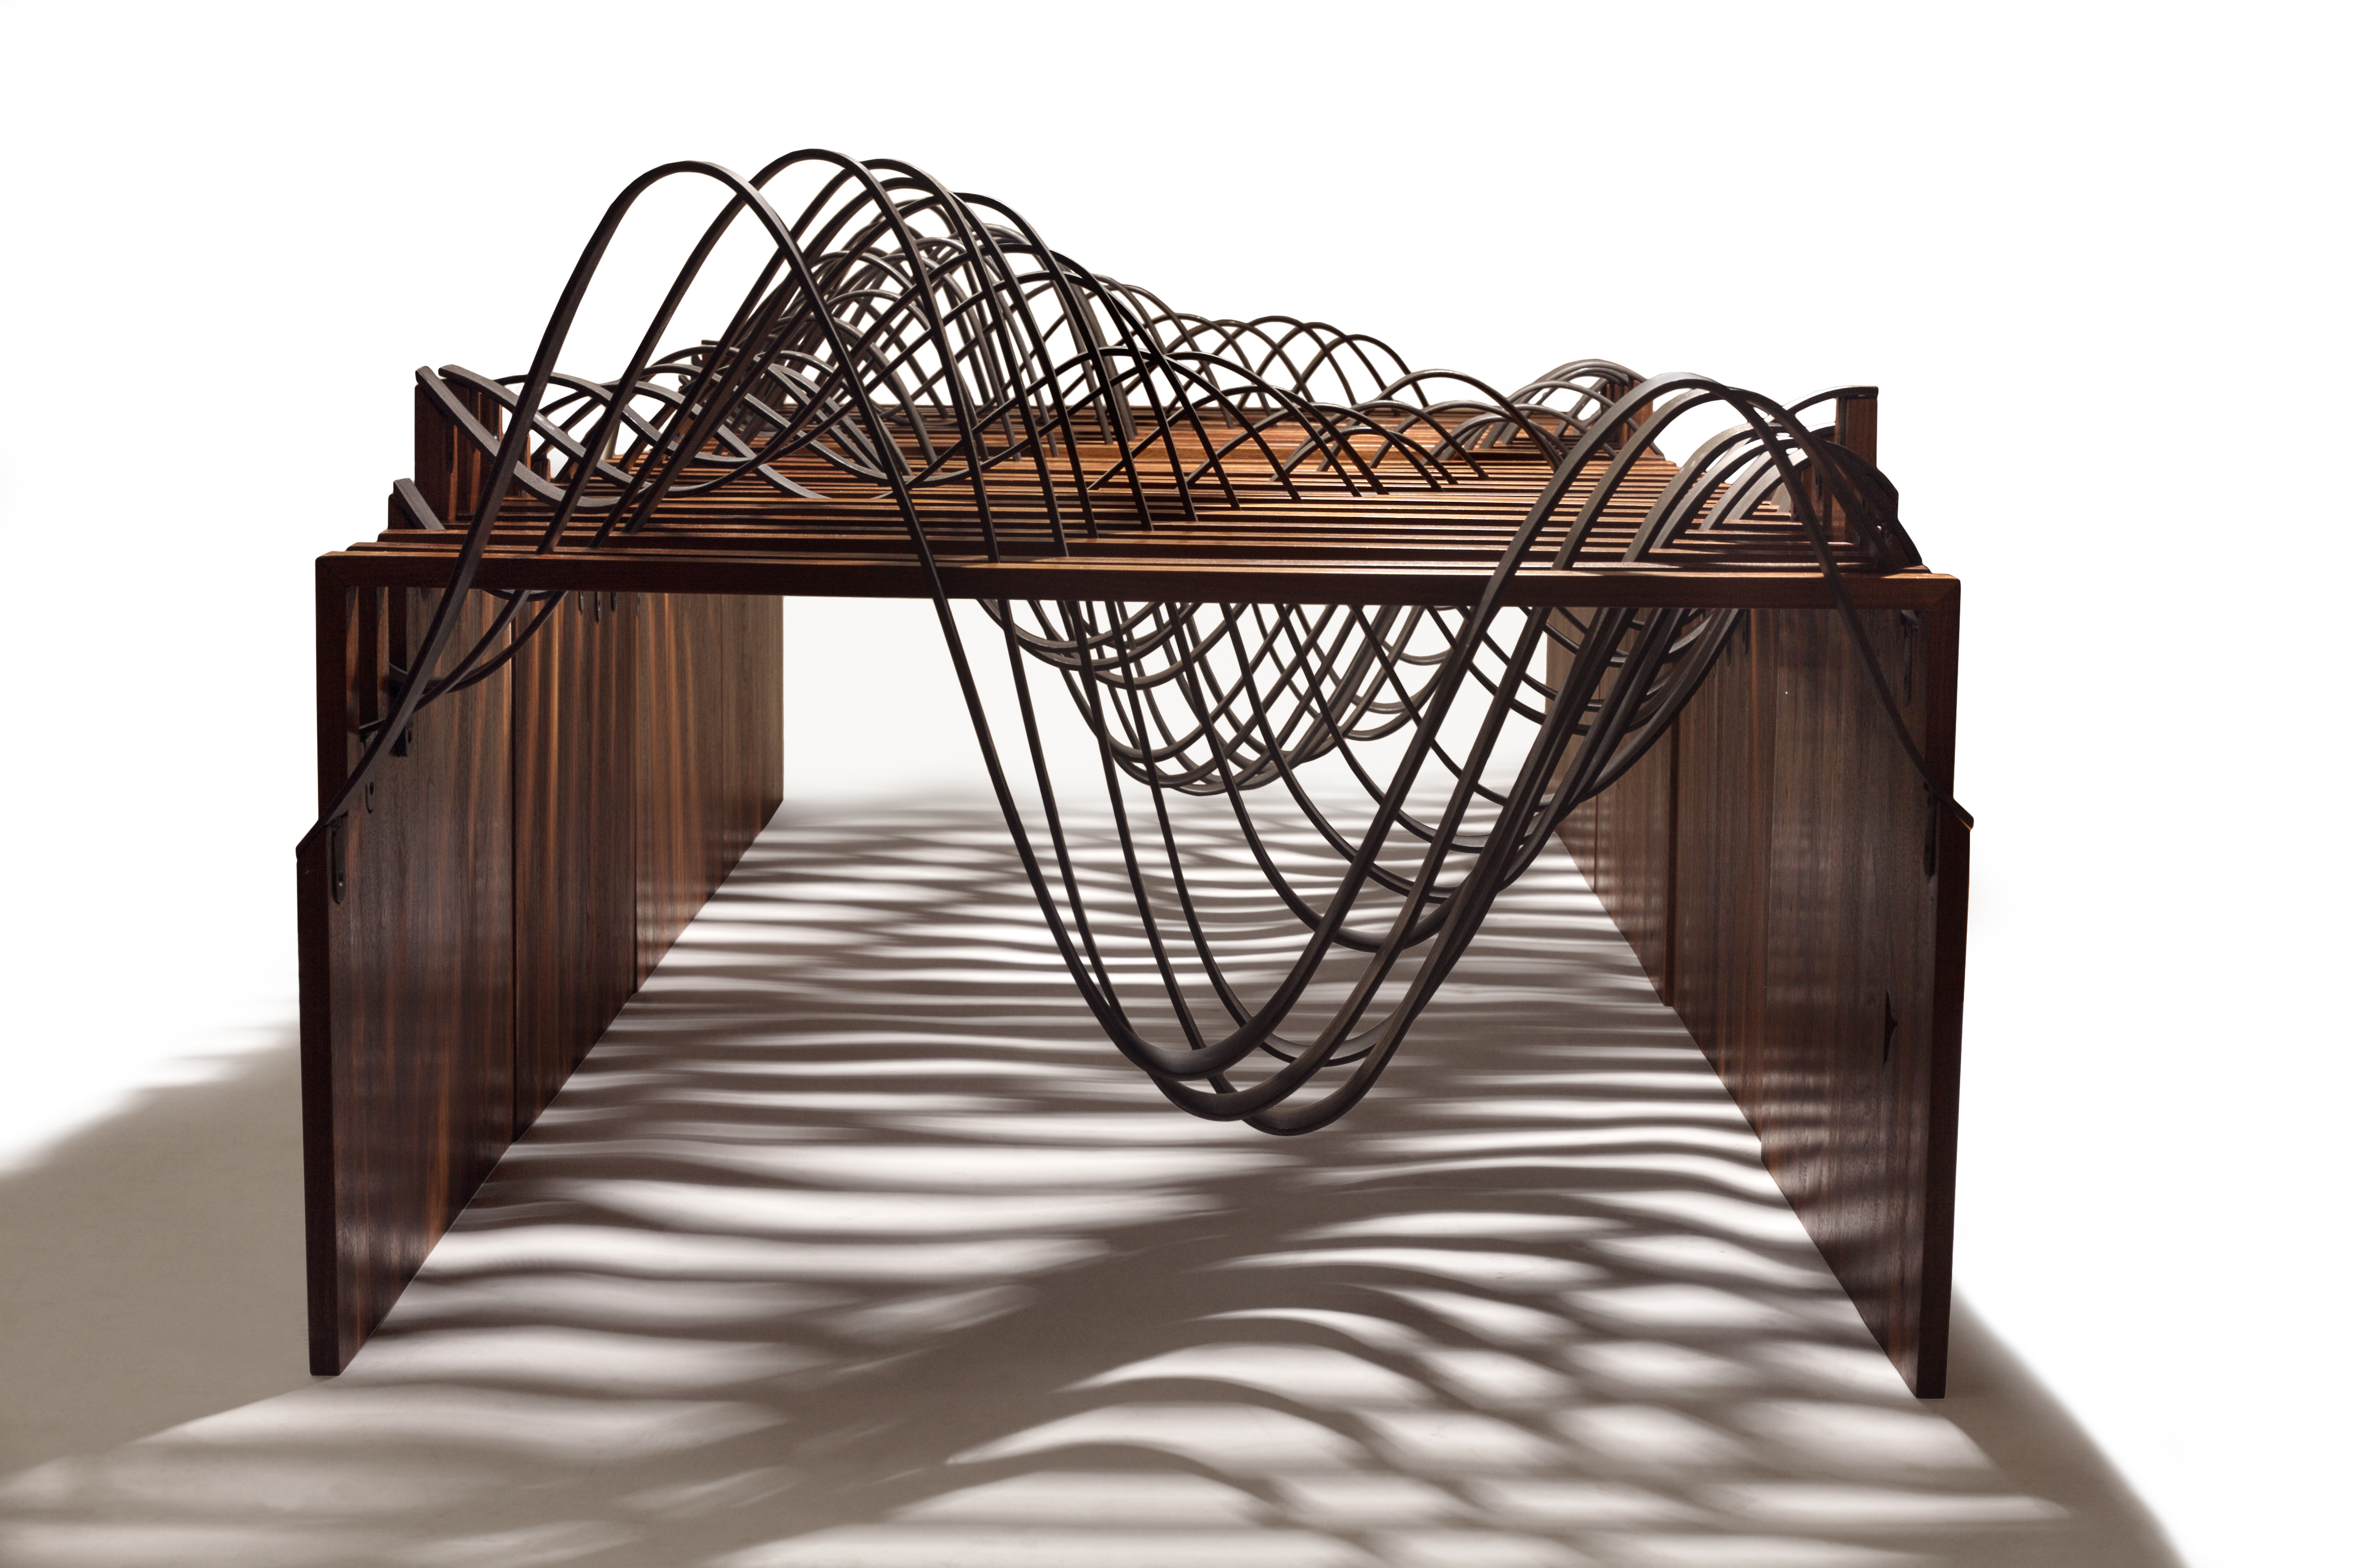
My name is Adrien Segal and I am the current Artist-at-Sea aboard the R/V Falkor for the next 35 days, sailing with the scientific team studying the Sea Surface Microlayer (SSM). I am an artist based in Oakland, California, and my interdisciplinary approach spans the fields of science, art, data visualization, fabrication, and digital technology. I work in a variety of two and three dimensional media, including cast glass and bronze, wood, marble, metal, clay, and even cast ice.

Sculpture is an aesthetic language I use to bridge the gap between reason and emotion. The deep disconnect between scientific rationality and the emotional nature of human experience draws into question where we find meaning and how we seek to answer fundamental questions about life. My work is an exploration into the ways in which culture and society have been shaped through science and technology, and how to reconcile reason and fact with an intuitive and emotive experience to better communicate significant scientific developments of our time.
Artistic Process
My process usually begins with a highly personal experience in a natural setting that inspires and drives forward an inquiry into how a particular natural phenomena is abstracted, measured, and studied through the scientific lens. In addition to science, my interdisciplinary research draws from history, data visualization, materiality, and sensual perception. I interpret scientific research into art by translating data into lines, forms, and materials to reveal trends, patterns, and relationships as physical sculptures. In this way, the data is synthesized from information into a form of situated knowledge that humans can experience in physical space.
What is Data Art?
Representing data in the form of an artwork or a physical artifact is not a new practice, although calling it “data art” is a fairly recent development. In the words of my friend and a contemporary data art pioneer Loren Madsen, data art can be defined as “Art whose form in large part is determined by data or information.” It is pretty straight forward, but the field is still evolving and as such is open to new interpretations. The term “Data Physicalization” has been suggested to refer to data-driven physical artifacts, of which there are examples dating very far back in human history, such as Incan Quipus from around 2600 BC. The Inuit Ammassalik Maps (c.1885) are another example of a physical artifact containing data. These hand sized carved wood contours of the Greenland coast were likely used as a guide and device for storytelling rather than for practical navigation. A comprehensive archive with other examples of physicalized data, the majority of which have been created in the last 15 years, is accessible in an online resource.
While On the Falkor…
Joining the science team aboard the Falkor has been quite a phenomenal experience so far, and it is only day Two at sea. The team is in the process of testing the equipment and instruments, and once they are deployed and the data starts coming in, I will have the source “material” to start translating into forms and physical materials. I am told the data will be extensive, and will include thermal mapping, chemical analysis, energy absorption, and spectrometer readings of ocean color.

Hook and Engage
In the meantime, I have been asking different members of the team countless questions about their field of research and the implications it may have in a larger context. One particularly unique attribute about being an Artist-at-Sea with the Schmidt Ocean Institute (aside from being on a ship in the middle of the ocean) is that the artist works alongside the scientific team. The artwork to come will be directly influenced by casual conversations, an exchange of methodologies, and shared knowledge. This deeper connection will likely affect the ways in which I select, interpret, and refine the data itself. The question I have set out to explore is: How can we synthesize scientific data into knowledge that is meaningful and compelling to people in the form of art?