Picture Mount Everest, and, on top of that, add One World Trade Center four times over (~36,000 ft total), now imagine a credit card (~1 mm) sitting on top. The former gives some sense of scale for the deepest point on planet Earth, the Mariana Trench; the latter is the thickness of the sea surface microlayer.
A Boundary Between the Ocean and Atmosphere
With so much focus on the deep sea, the vast unknown, and the secrets within, it is easy to overlook the
surface itself – however, this sliver of a boundary between the atmosphere and the ocean is not something to
take for granted. It controls all transfer between the atmosphere and the ocean, serving as a mediator of air-
sea gas exchange; it plays a huge role in marine biogeochemical cycles and air-sea interaction, and it creates
the link between all the complex processes that meet at the sea surface. So, despite vast scale of the body of
water beneath, the surface microlayer is more important to many environmental processes than most would
know.
Studying Air To Sea Interaction
Building upon previous work, conducted by Christopher Zappa, Oliver Wurl, et al in 2016, the team will be able to do everything from measuring solar radiation, rain drop size and studying the ocean’s ‘skin’ and surface currents, to collecting samples and data from the water column via the CTD (Conductivity, Temperature, and Depth) Profiler, measuring water column characteristics using an ‘apex float’ (a float that moves up and down autonomously) and measuring light in the water with a spectral radiometer. They will also be collecting data and samples via a remotely piloted catamaran; a vehicle which, amongst other things, utilizes a ‘skimmer’ – a rotating glass disk that skims the sea surface microlayer, sampling the top 1mm.
Creating Maps like We’ve Never Seen Before
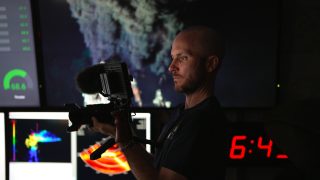
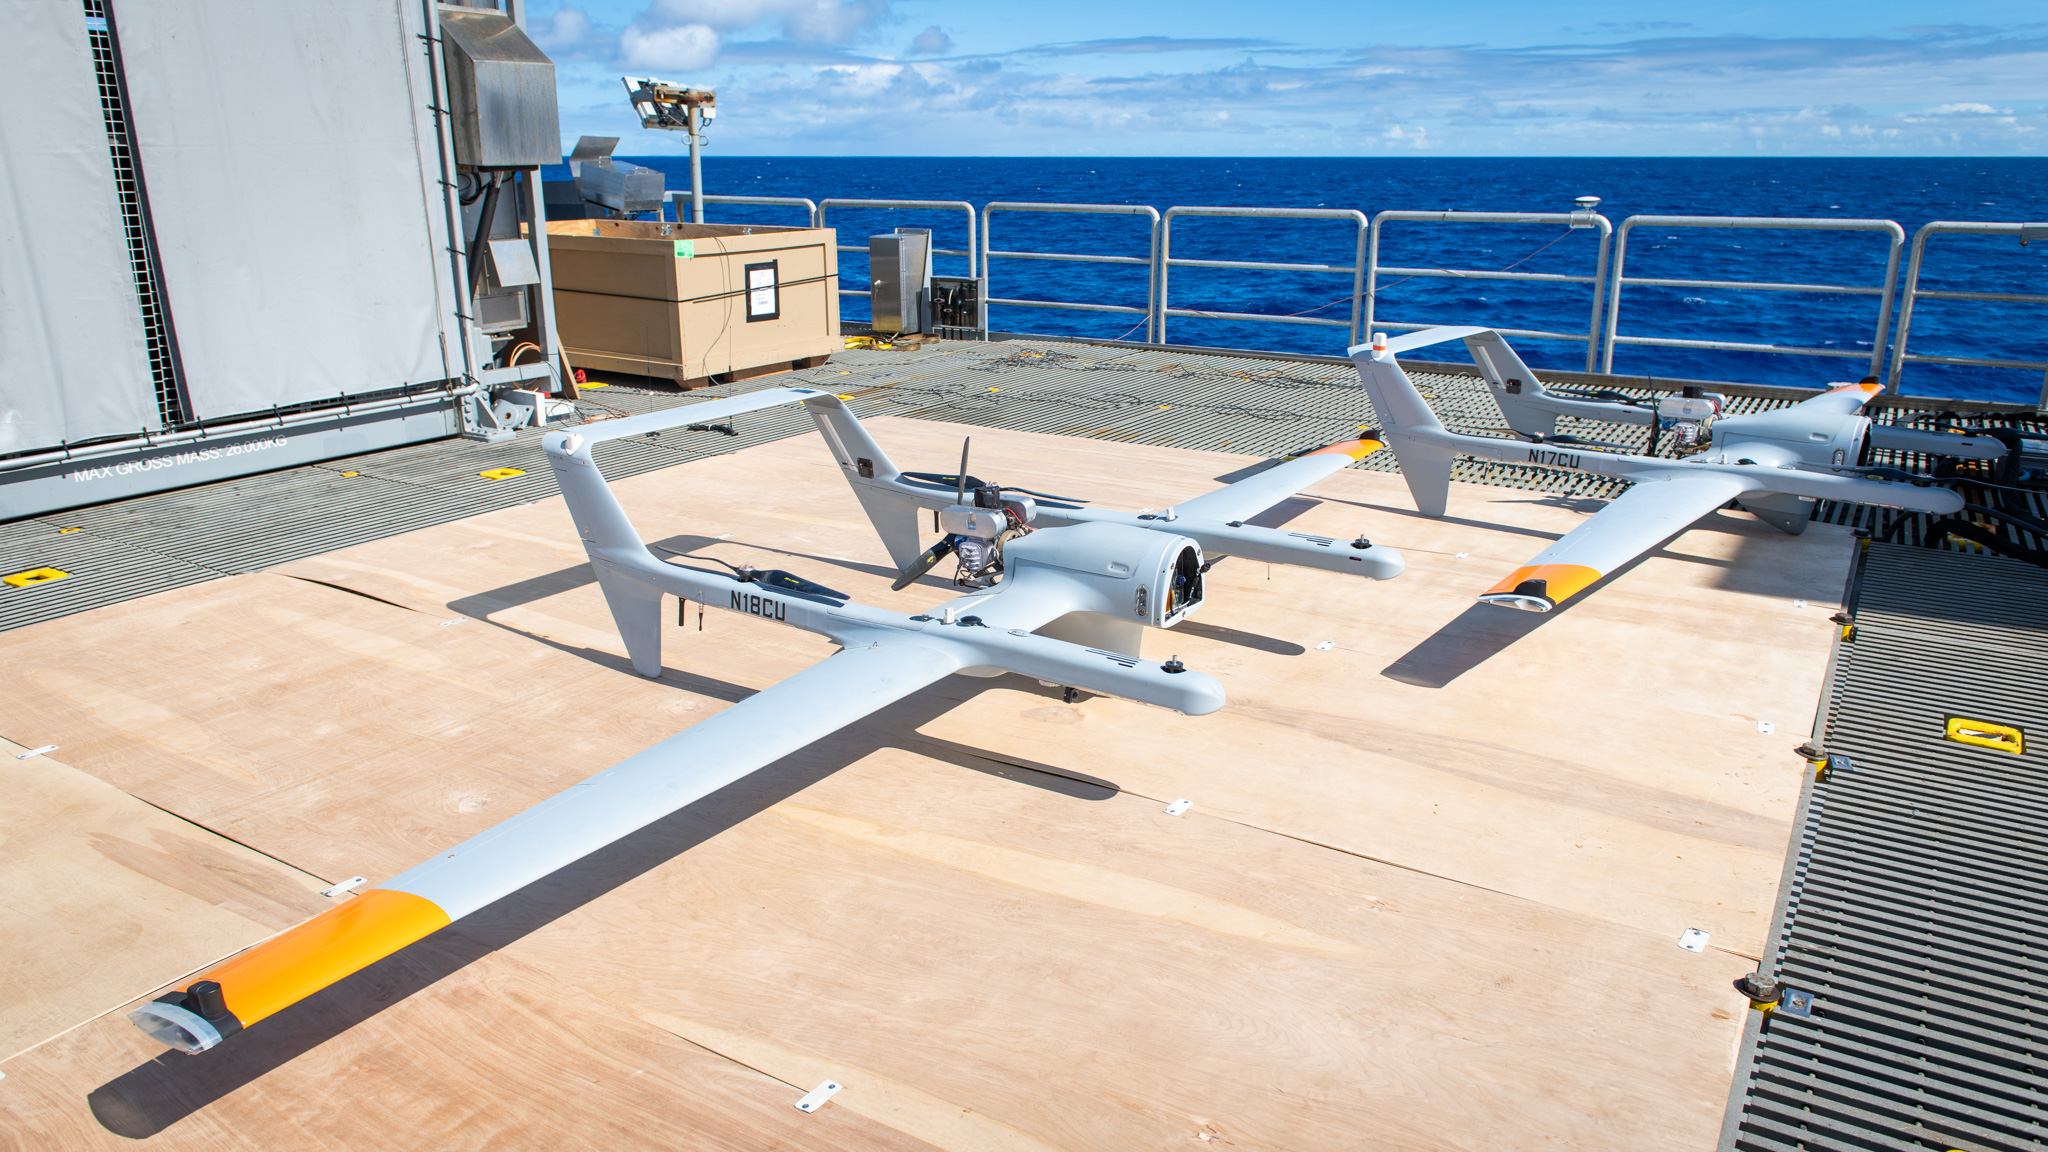
This expedition brings new and improved technology to the fore. The team are expanding the capabilities of the Unmanned Aerial Vehicles (UAVs) this year including i) autonomous takeoff and landing from a moving ship, ii) multi-aircraft high-endurance missions (up to 12 hours), iii) real-time high-bandwidth image telemetry up to 50 nm. The latter allows the scientists to focus the flight mission during the flight, acting as the eyes over the horizon, to target the features of interest more easily in real time. Without image telemetry, it would mean waiting 8 hours until the mission is completed before finding out specific
locations upon which to concentrate. Alongside the UAVs, and the atmospheric and oceanographic data they collect, the team will be taking measurements from equipment mounted on R/V Falkor as well as deploying instruments and remote-controlled sampling vehicles, such as the catamaran.
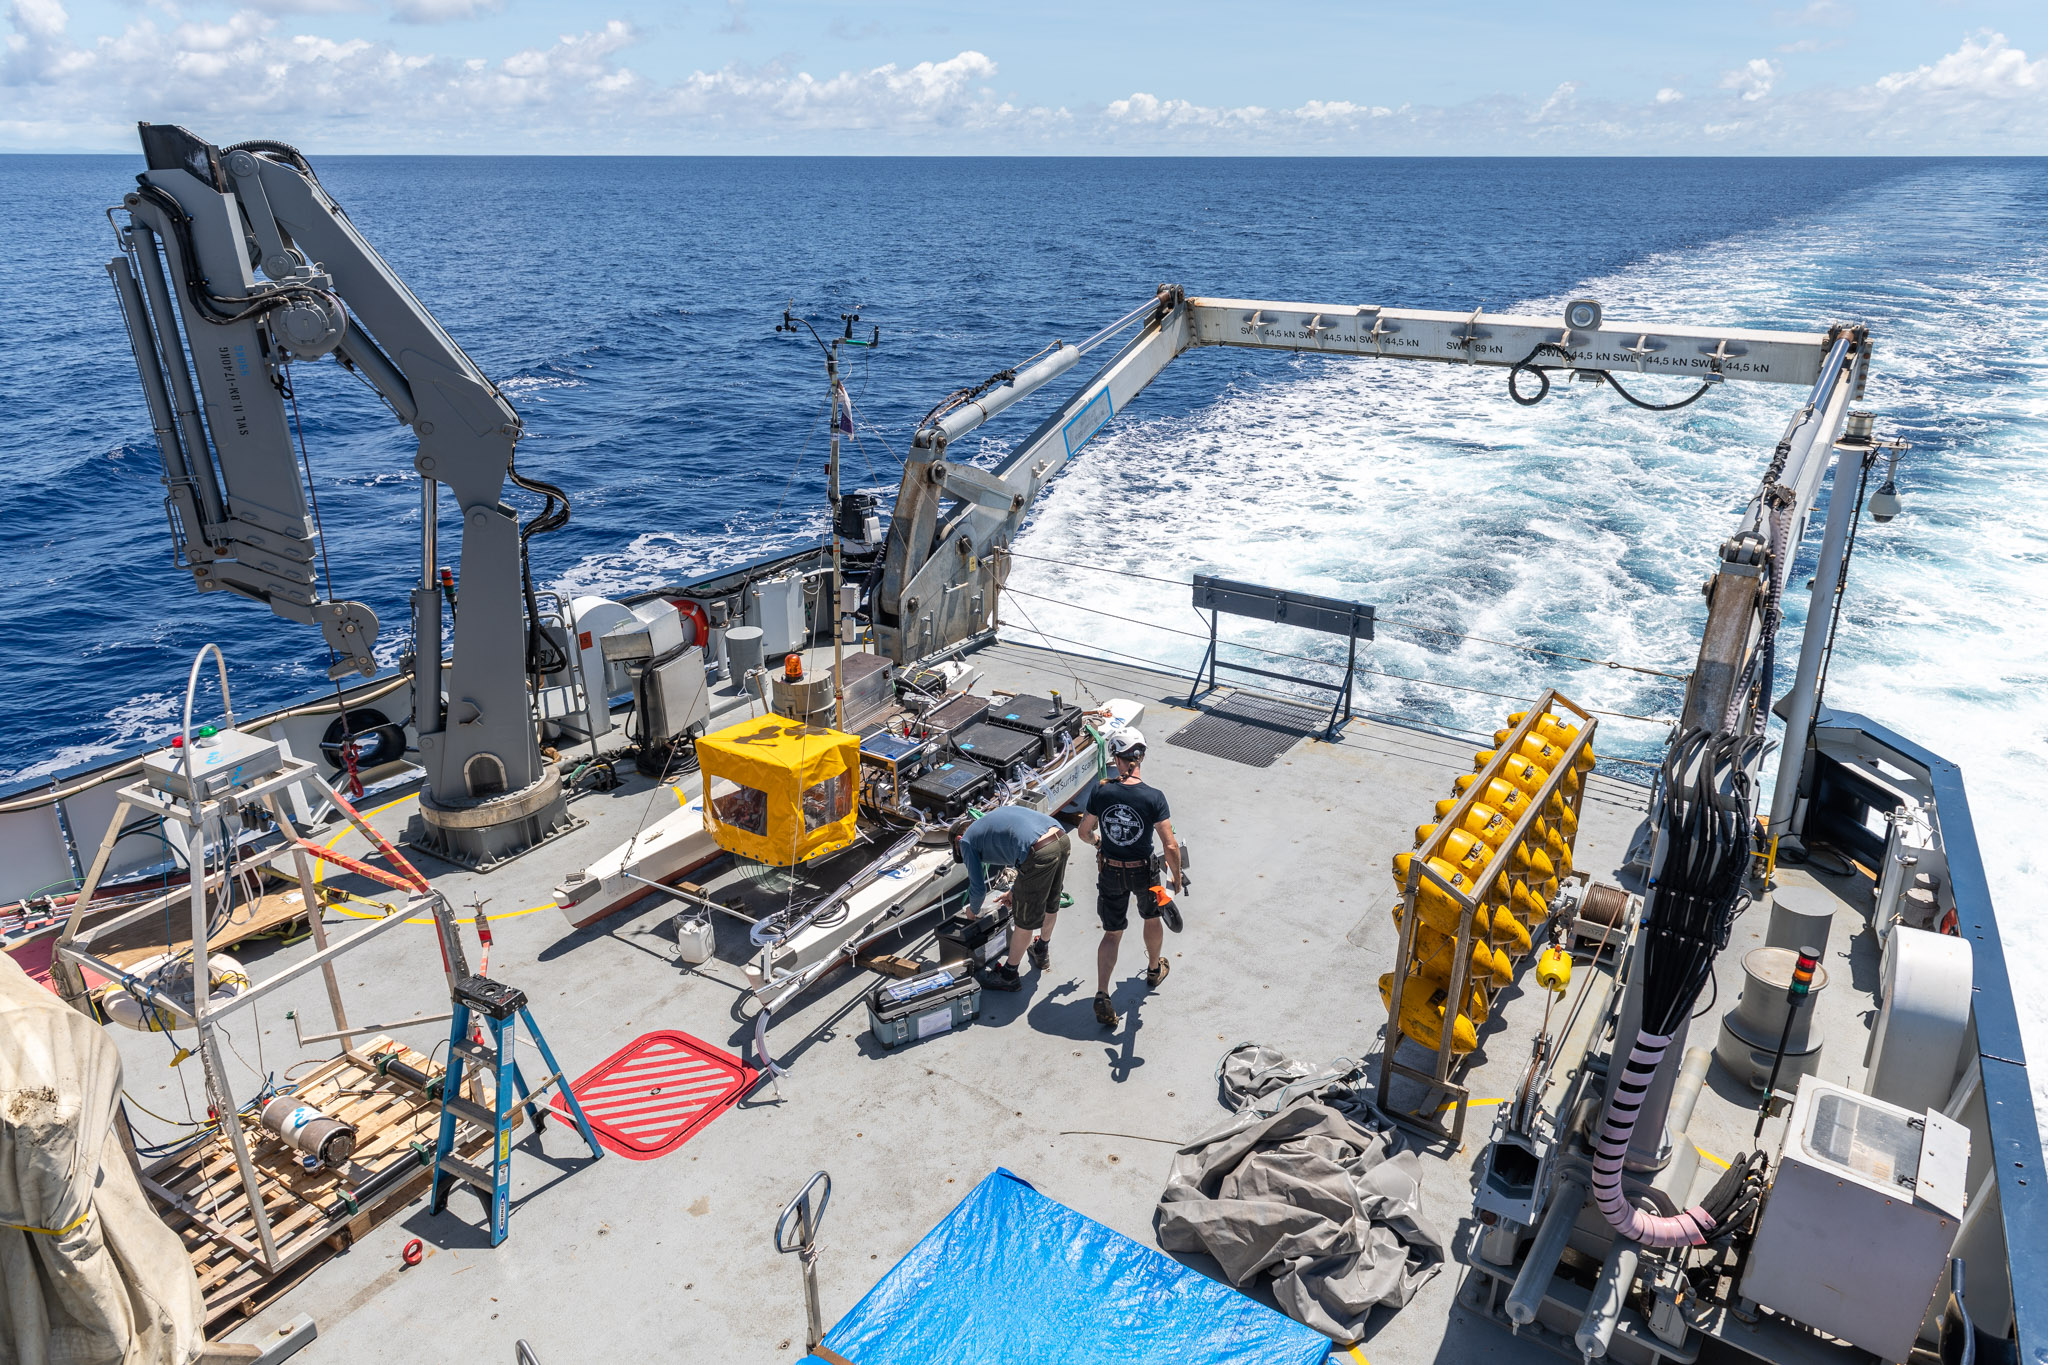
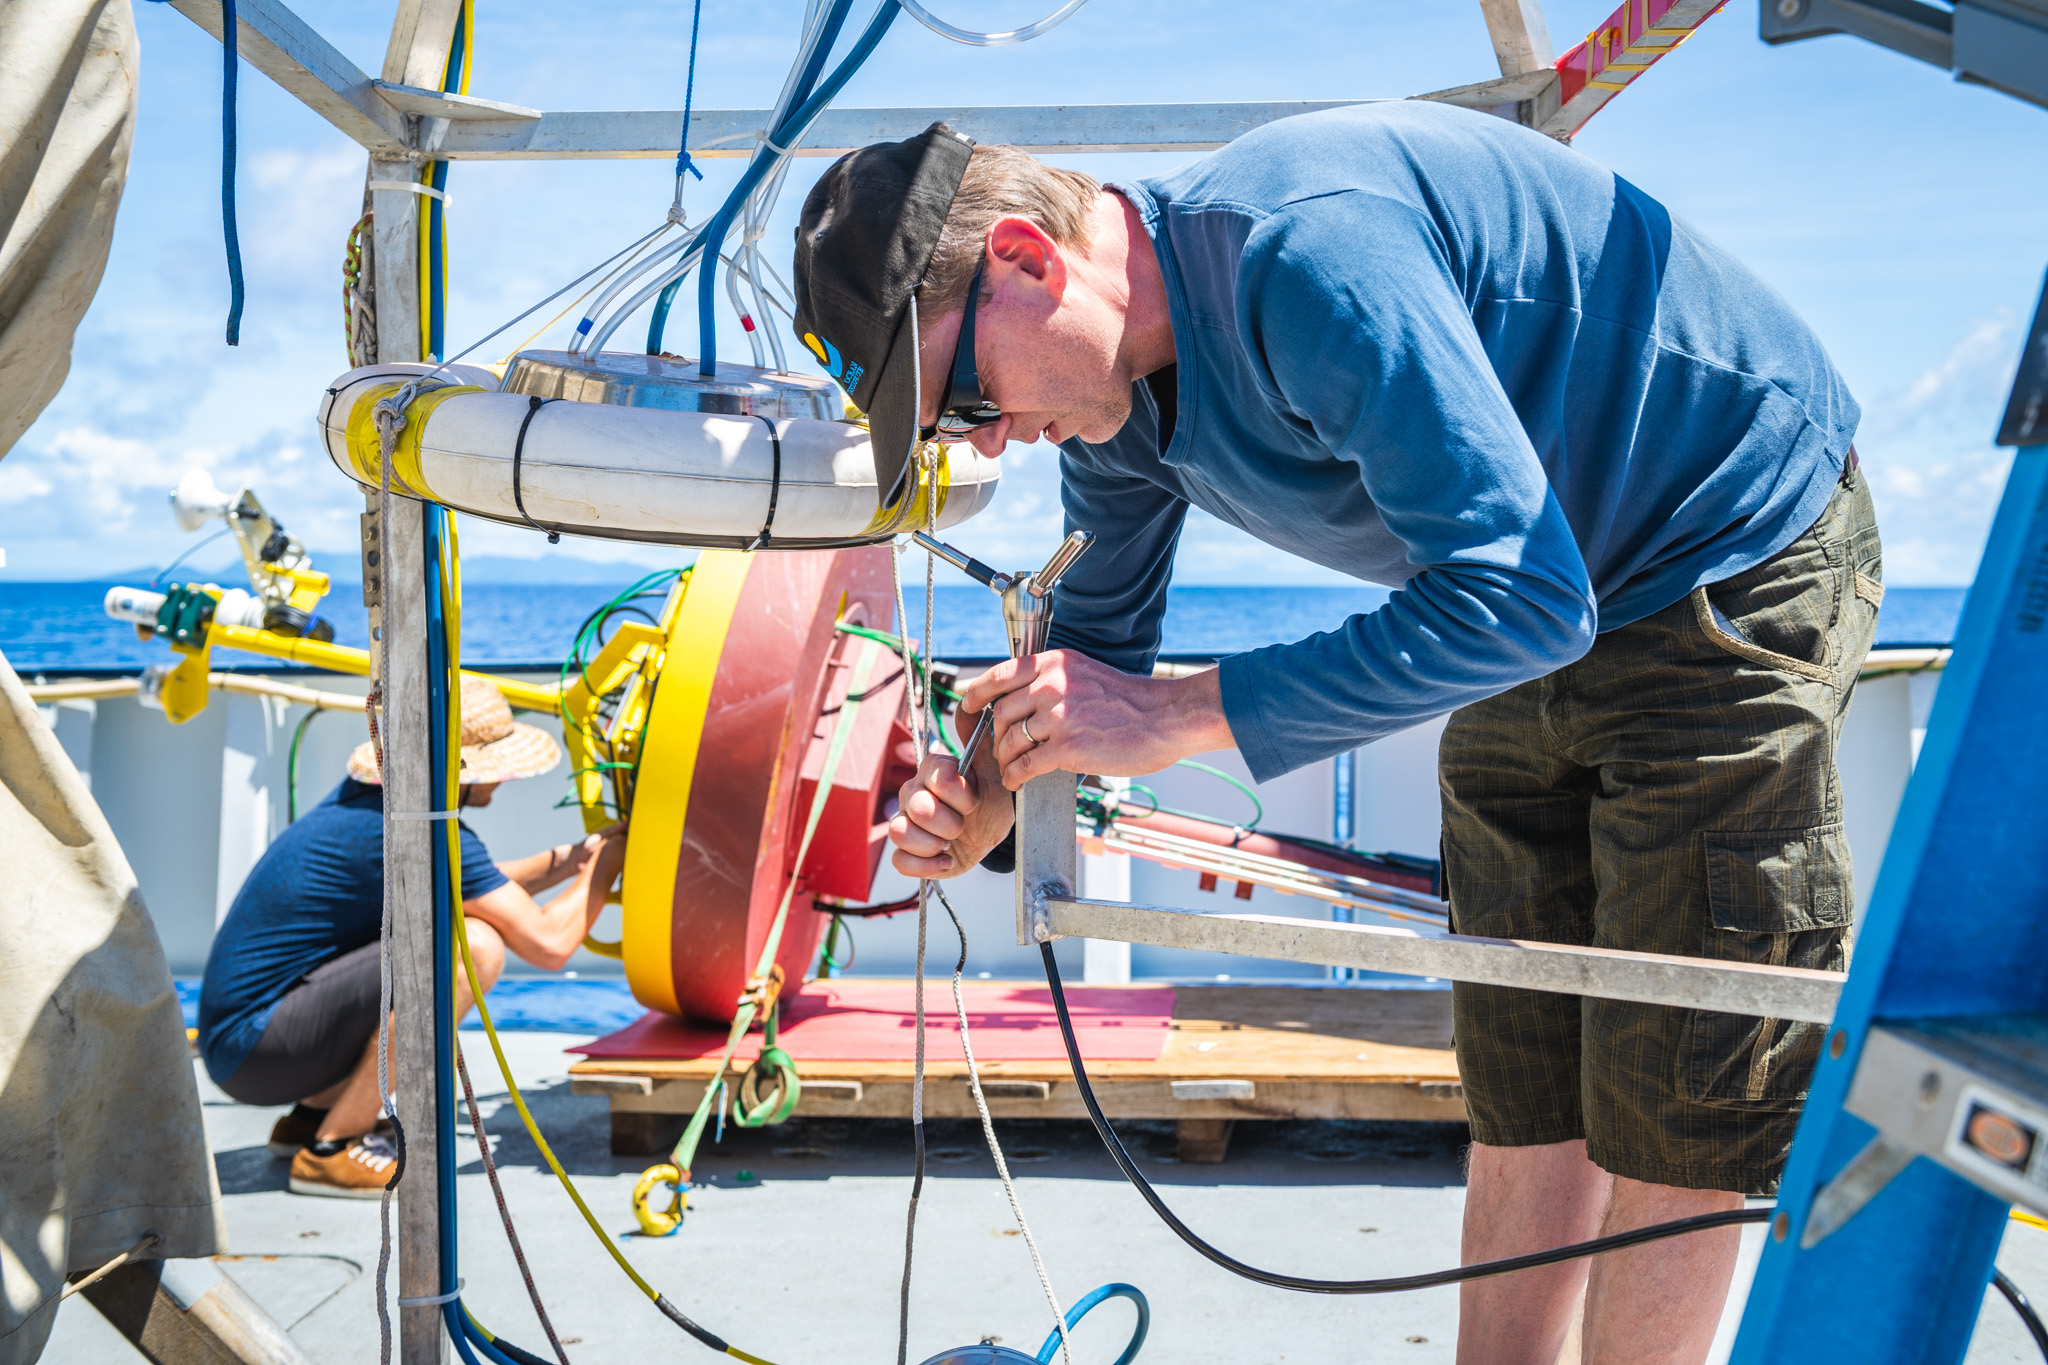
Other equipment includes the SPIP (Surface Processes Instrument Platform) which measures temperature,
salinity, currents and mixing in the top 1m of the ocean; and the ‘Sniffle,’ which allows the in-situ observation and sampling of CO2 fluxes. Tying all of this together will be the data which the UAVs collect, allowing the team to visualize their findings in wonderful detail.
With this huge variety of equipment potentially yielding all manner of exciting data, the aim is to produce sea
surface maps in a spatial and spectral resolution never seen before, all addressing crucial questions about the
ability of the ocean surface to absorb heat.