My name is Shellie Habel. I’m a PhD candidate in the field of Coastal Geology, and an aspiring public servant. Currently I work as part of a team that makes maps. These maps are used to identify the various types of flooding that will occur among the Hawaiian Islands as sea levels continue to rise (FYI: sea level in Honolulu has risen about a foot over the past century). Sea-level rise related flooding comes from various sources including wave run-up, backflow through storm-drains, and (arguably most frightening) by groundwater inundation, which results from groundwater rising above the surface of the ground. To visualize how flooding will progress, my colleagues and I simulate increments of sea-level rise likely to be reached over the coming decades. This helps stakeholders better understand both short-range and long-range flood scenarios. The results of our work point to one clear conclusion: Hawaii’s coastal municipalities – and others located around the globe – have their work cut out for them.
The research my colleagues and I do is rewarding (however formidable), as the maps are used to inform various agencies on projects that strengthen the resilience of our State. For instance, planners use them to avoid building at elevations – or in locations – that are expected flood; agencies that oversee critical infrastructure use them to prepare vulnerable assets for future submersion; policy writers use them to inform policy towards incentivizing best practices regarding land use. The maps are great tools for answering the question of where the vulnerabilities exist. However, the question of when the various stages of flooding will ensue is a much more challenging one to answer.
To Illustrate the Importance of When…
NOAA scientists recently published a groundbreaking report that provides physically feasible scenarios of sea-level rise by 2100 for specific locations around the world (Sweet et al., 2017). The report includes global average estimates ranging from 0.3 to 2.5 m of rise by 2100, with an intermediate estimate of 1.5 m specific to the Honolulu area. While results of the NOAA study represent a big step from a scientific standpoint, they provide little to work with from a planning and policy perspective. As one might imagine, planning a city’s long range future considering 0.3 m of rise looks very different than one considering 2.5 m. For reference, just take a look at the attached maps that apply NOAA projections to the Waikiki area. One might suggest to err on the side of safety by simply considering the higher end of this range…but in a world where infrastructure lifespans are finite and budgets are tightening, it’s just not that simple.
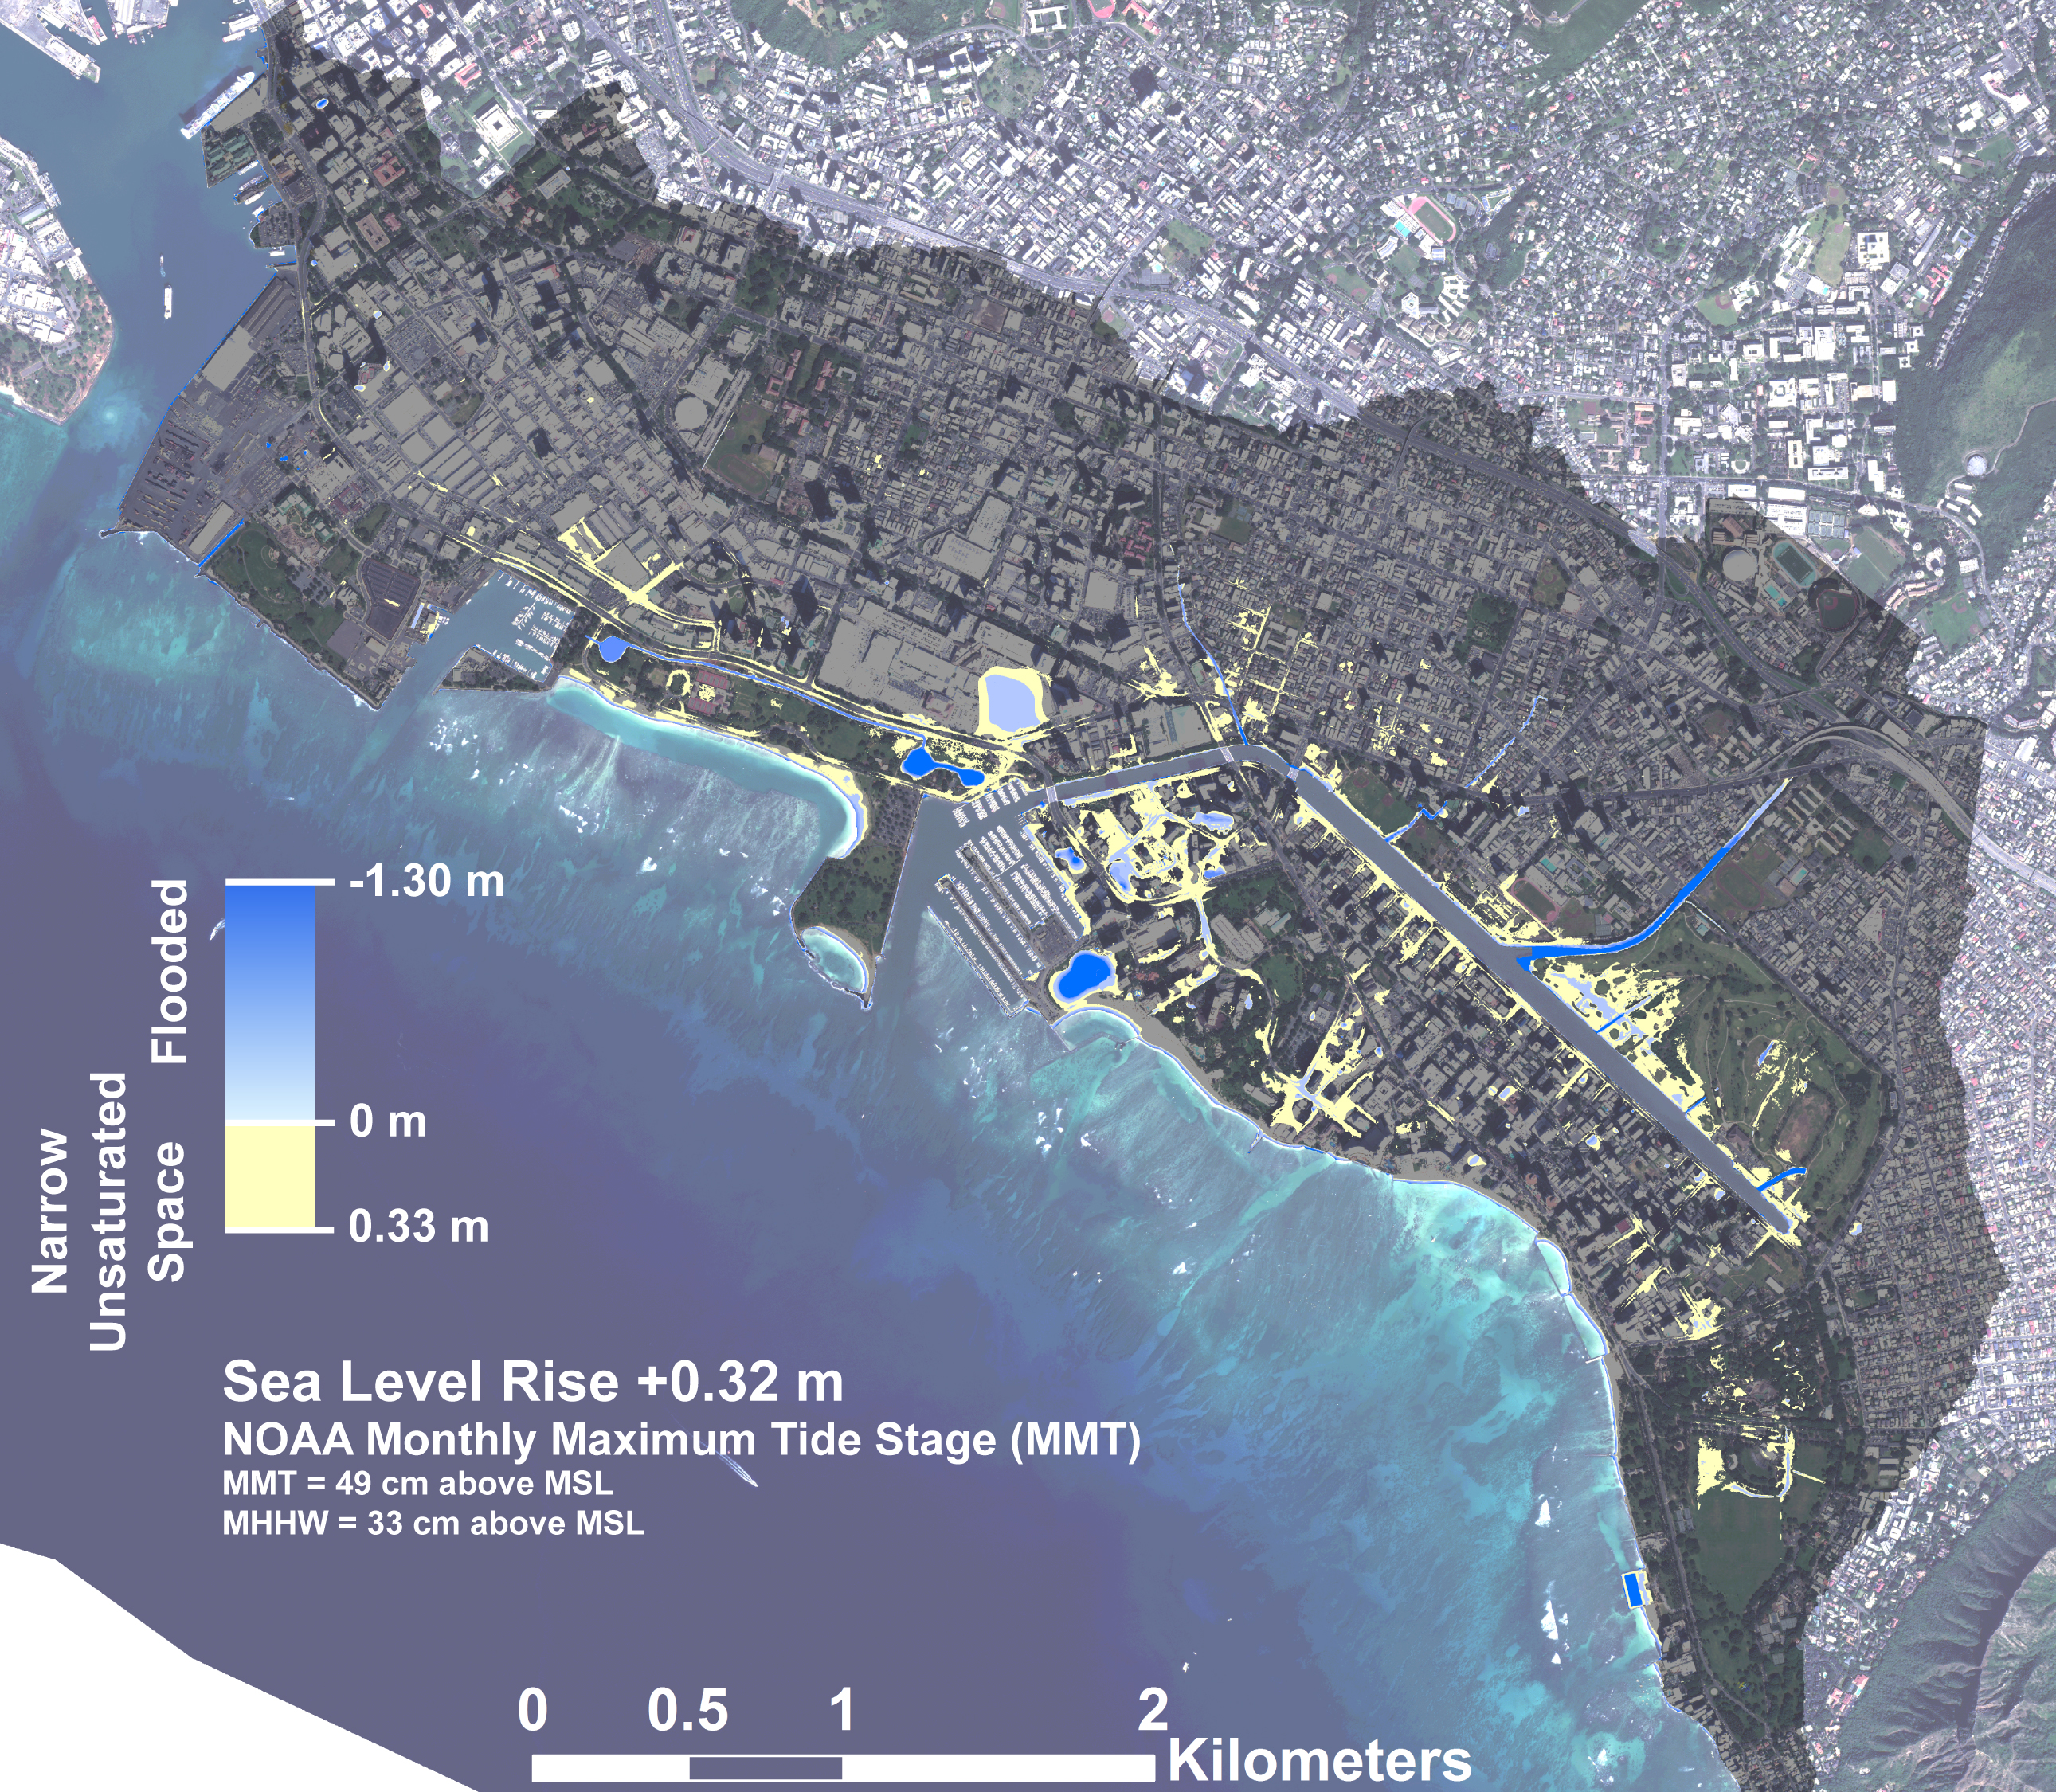
Figure: Maps of Waikiki, Hawaii, showing areas projected to be flooded (blue). Areas projected to have very little freeboard between groundwater and the ground surface are also shown for consideration of buried infrastructure (yellow).
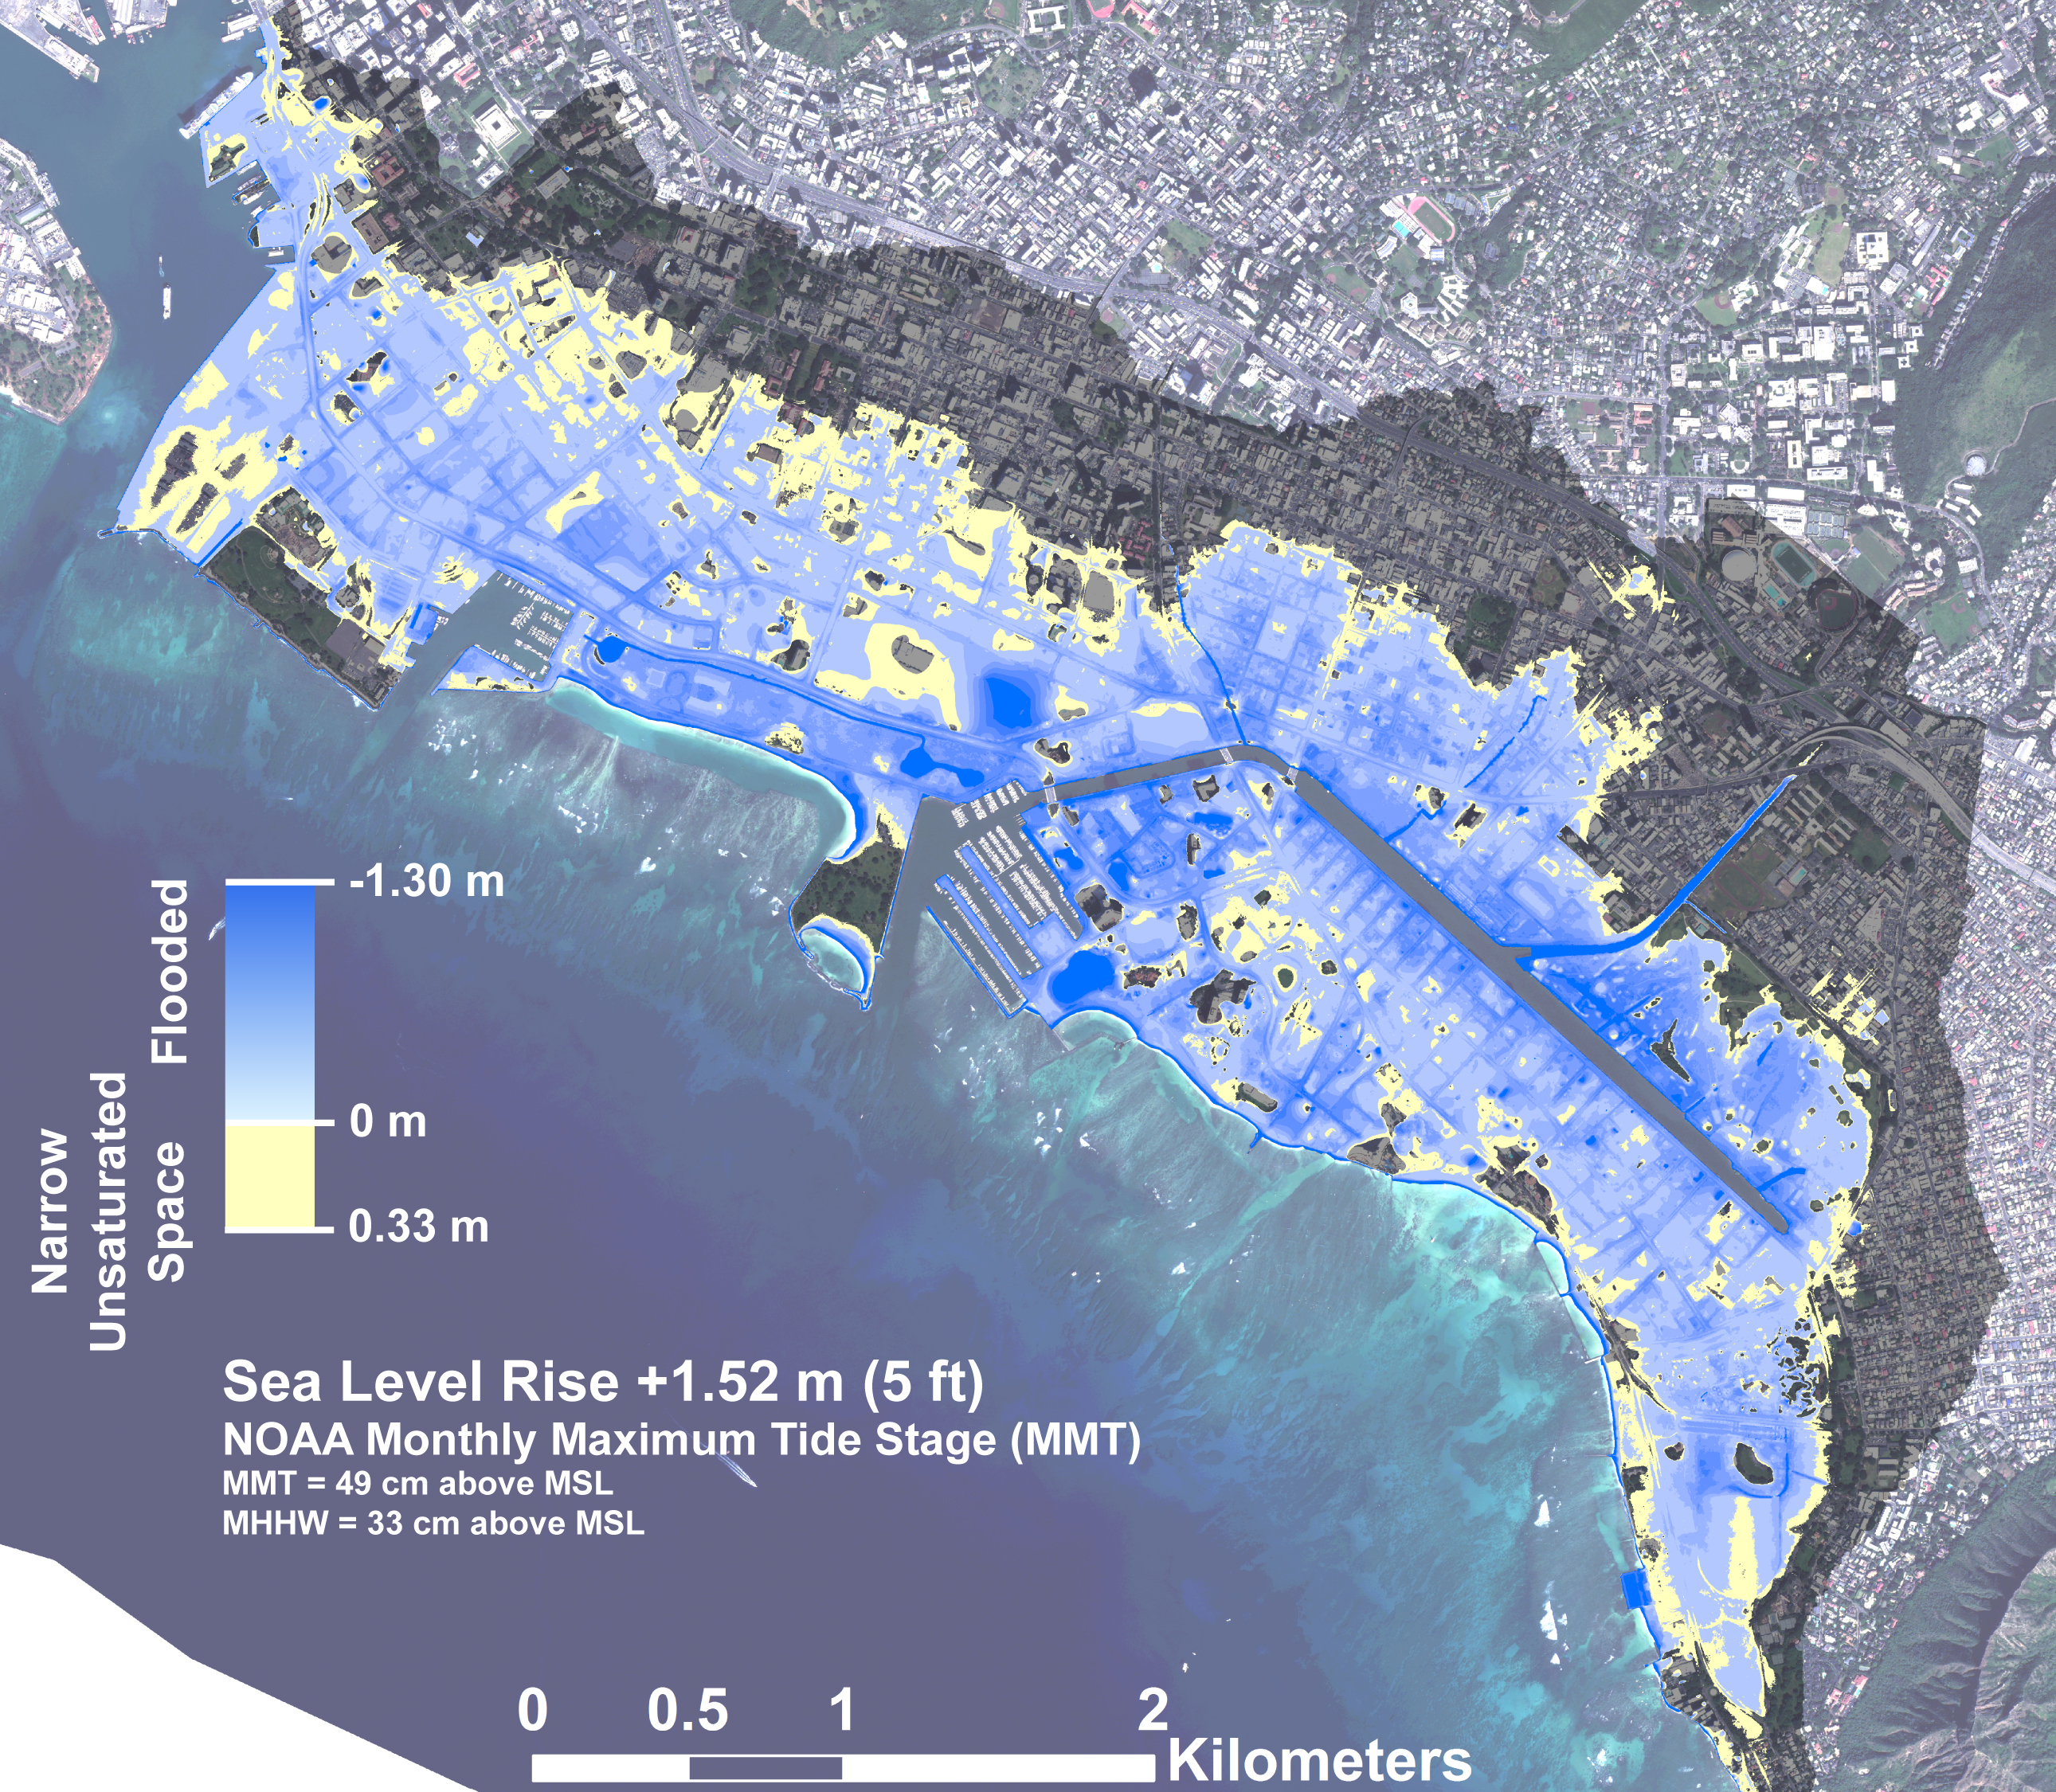
The map on the left shows flooding considering sea-level rise approximate to NOAA’s low scenario, while the map on the right shows flooding considering NOAA’s intermediate scenario particular to the Honolulu area.
Foundations To Build Upon
All scientific studies generally rely upon preceding research efforts that provide the necessary foundation to move forward. Google Scholar, among others, describe this practice as standing on the shoulders of giants. The giants who own the shoulders on which my colleagues and I stand are researchers brave enough to explore this shifty question of when.

Over the geologic instant that our flood maps represent, sea levels will rise in response to an overabundance of interwoven phenomena. To name a few: global temperature increase will spur changes in ice-melt, shift patterns in atmospheric and oceanic circulation, and cause thermal expansion of water. Global temperature increase itself will be spurred by a sum of factors including deforestation, variations in energy emitted by the sun, volcanic activity, and our addiction as humans to burning things. Further complicating matters is the tendency of land to move up/down at unique speeds due to geologic (or man-made in some cases) processes. Sea-level rise is fiercely complicated!
Each of these interwoven phenomena require a separate set of studies. In turn, the results of such studies are used strengthen models that supply projections of sea-level rise. In essence, when my colleagues and I produce flood maps for Hawaii using these projections, we stand on the shoulders of giants who stand upon giants.
Today, my shipmates and I aboard the R/V Falkor have been busy collecting data in the form of ancient drowned coral reefs. This data will be used in combination with the results of various other research efforts to improve sea-level rise projection models…all so that we can further understand the when that coastal municipalities rely on to prepare for future flooding. And upon the shoulders of these many giants, my mapping colleagues, and my shipmates, a more significant question rests…how shall we move forward?
Sweet, William, R. E. Kopp, C. P. Weaver, Jayantha Obeysekera, Radley M. Horton, E. Robert Thieler, and Chris Zervas. Global and regional sea level rise scenarios for the United States. No. CO-OPS 083. 2017.