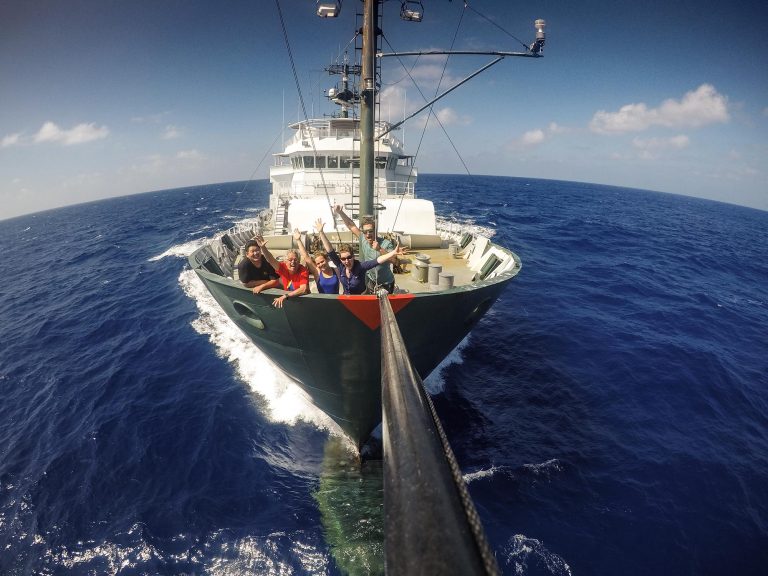
Ten days of transit gave Falkor’s outreach team an opportunity to familiarize themselves with the vessel, learn all about multibeam mapping, and integrate with the crew. At this point, Brock Callen Jr., Lucy Bellwood, Andrew Kang, Jena Kline and Brock Callen Sr. have all stood watch, observed data acquisition, and gained awareness into the adventurous and selfless quest of an oceanographic expedition. One by one, the seamounts of the far corners of the Johnston Atoll Unit in the Pacific Remote Islands Marine National Monument continue to fill the screen of Falkor’s Control Room. In this blog, the team reflect on this experience so far.
Falkor is a New Experience Altogether
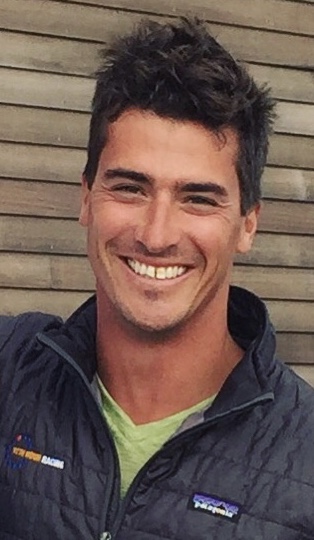
Brock Callen Jr – 11th Hour Ambassador: I would like to think I have spent a pretty decent amount of time on the sea and in the ocean. Being on Falkor is a little different from what I am used to though. High speed internet, clean laundry, epic eating: these are the nuances that I could really get used to. But I have to say it is somewhat torturous to be out here, in the middle of the Ocean and not be able to interact with the natural elements. As an 11th Hour Racing Ambassador and Pro Sailor/Kiteboarder I am far more comfortable being intimate with the Ocean. I am used to getting wet, to reacting to the wind, trimming sails, and working together to make the boat go faster. Here we are reacting to the science to make the data more complete. While I do love this new aspect of interaction, I am desperately looking forward to getting in the ocean and doing what I love.
The Learning Curve
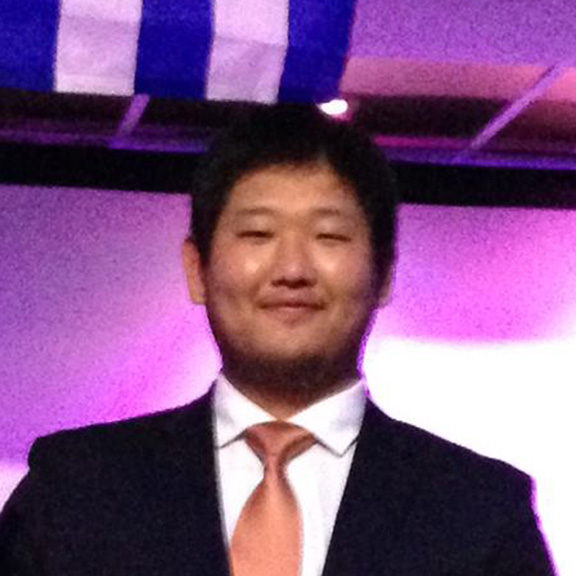
Andrew Kang – Students Opportunities Program Participant: After a week of mapping flat, featureless seafloor along our transit, I was happy to finally arrive at our survey site. The first few hours of my first watch were hectic and exciting at the same time, because we had to find the edge of the seamount with the multi-beam without knowing where it was exactly. The watch leader, Jonathan Tree, frequently contacted the bridge to adjust our direction so that the multibeam wouldn’t miss an important feature or miss the edge of the seamount. In the end, everything worked out and fell into place which was a big relief but it was much more exciting when we were scrambling in beginning to get things in order.
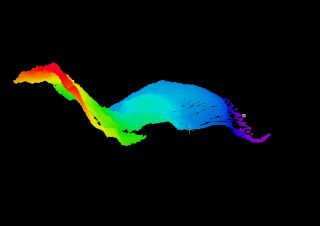
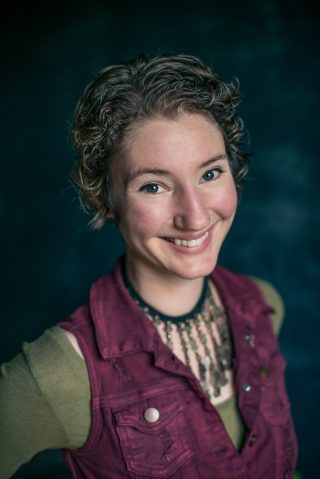
Lucy Bellwood – Adventure Cartoonist: Once we began mapping in earnest, I was relieved to realize that my experience with Adobe Photoshop aided me in picking up Qimera, our visual data processing program. Sniping off rogue blips of extraneous information is a meditative and visually intimate way of engaging with our findings in three dimensions. I love it. This morning, when we finally overlaid our backscatter data on the multibeam terrain map of our first seamount, my jaw hit the floor. What had appeared at first glance to be a mess of static and rainbow blotches resolved itself into a graphic understanding of the terrain below us in gorgeous detail. Numbers may be a challenge for me, but images make my world turn, and Falkor is really delivering the goods on this journey.
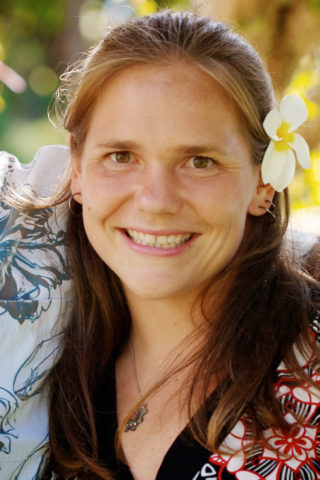
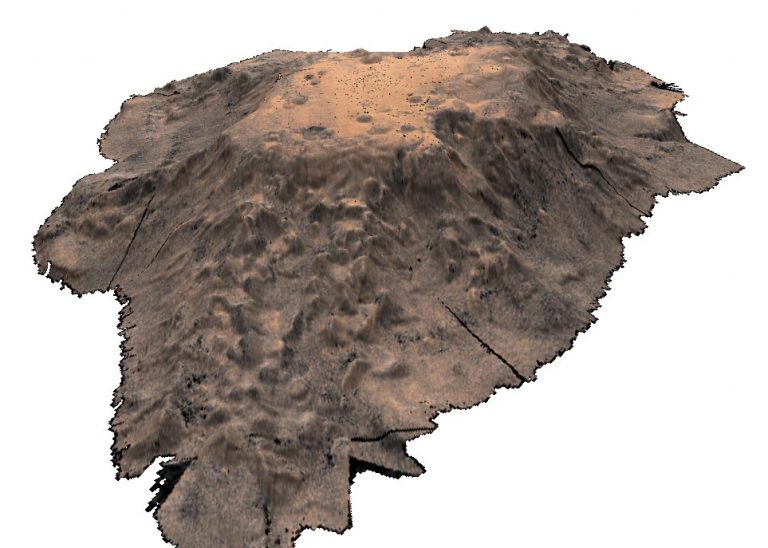
Jena Kline – Teacher at ‘Iolani School: We are starting to get a glimpse of the previously unmapped ocean floor near Johnston Atoll, and it is amazing! Today we were able to piece together numerous multibeam swaths to form the image of our first complete tabletop seamount. The detail is impressive and my eyes are drawn to the large gouge on the edge flat top. During swath processing, I remember seeing this anomaly and asking Joyce Miller, multibeam mapping scientist, what was wrong with the data. Her experience and eye for mapping told her it was real, and as the swaths combined into the bigger picture, we see this feature in all its glory. This is not a hole in the data or an outlier from the norm, but a prominent feature. Is the gouge a result of a landslide? What is the composition of the highly textured flanks? How old is this seamount? The big picture gives us detailed insight into the contours and composition of the depths, but also raises so many more questions. Thus is science!
Looking Forward
Brock Callen Sr. – Sail Martha’s Vineyard: In a perfect world how would I like to see the data developed on board Falkor used? It would be great for the data produced on this cruise, and shared openly by Schmidt Ocean Institute, to turn into an outreach effort to proactively direct the data to those organizations and universities that are involved in seabed research, specifically those using multibeam mapping and backscatter imaging for environmental purposes. The reason behind such an effort would be to more aggressively support those whose priority is the health of our oceans and their biosystems.