Nested mapping refers to the simple concept of working from big maps at lower levels of detail to smaller areas at higher levels of detail. The concept of nested mapping describes our approach to collecting the data throughout this cruise, and how we will be able to reconstruct whole tracts of ancient coral reefs from sonar data, some seafloor photography, and a few dated coral specimens.
This cruise “pinging” the seafloor describes pulses of sonar sound bouncing off the seafloor. Other blogs describe the technical aspects of turning this raw soundwave data into maps of depth (bathymetry) or seafloor hardness (backscatter). How do we turn bathymetry and backscatter into maps of seabed types and coral reef structure?
Two of a Kind
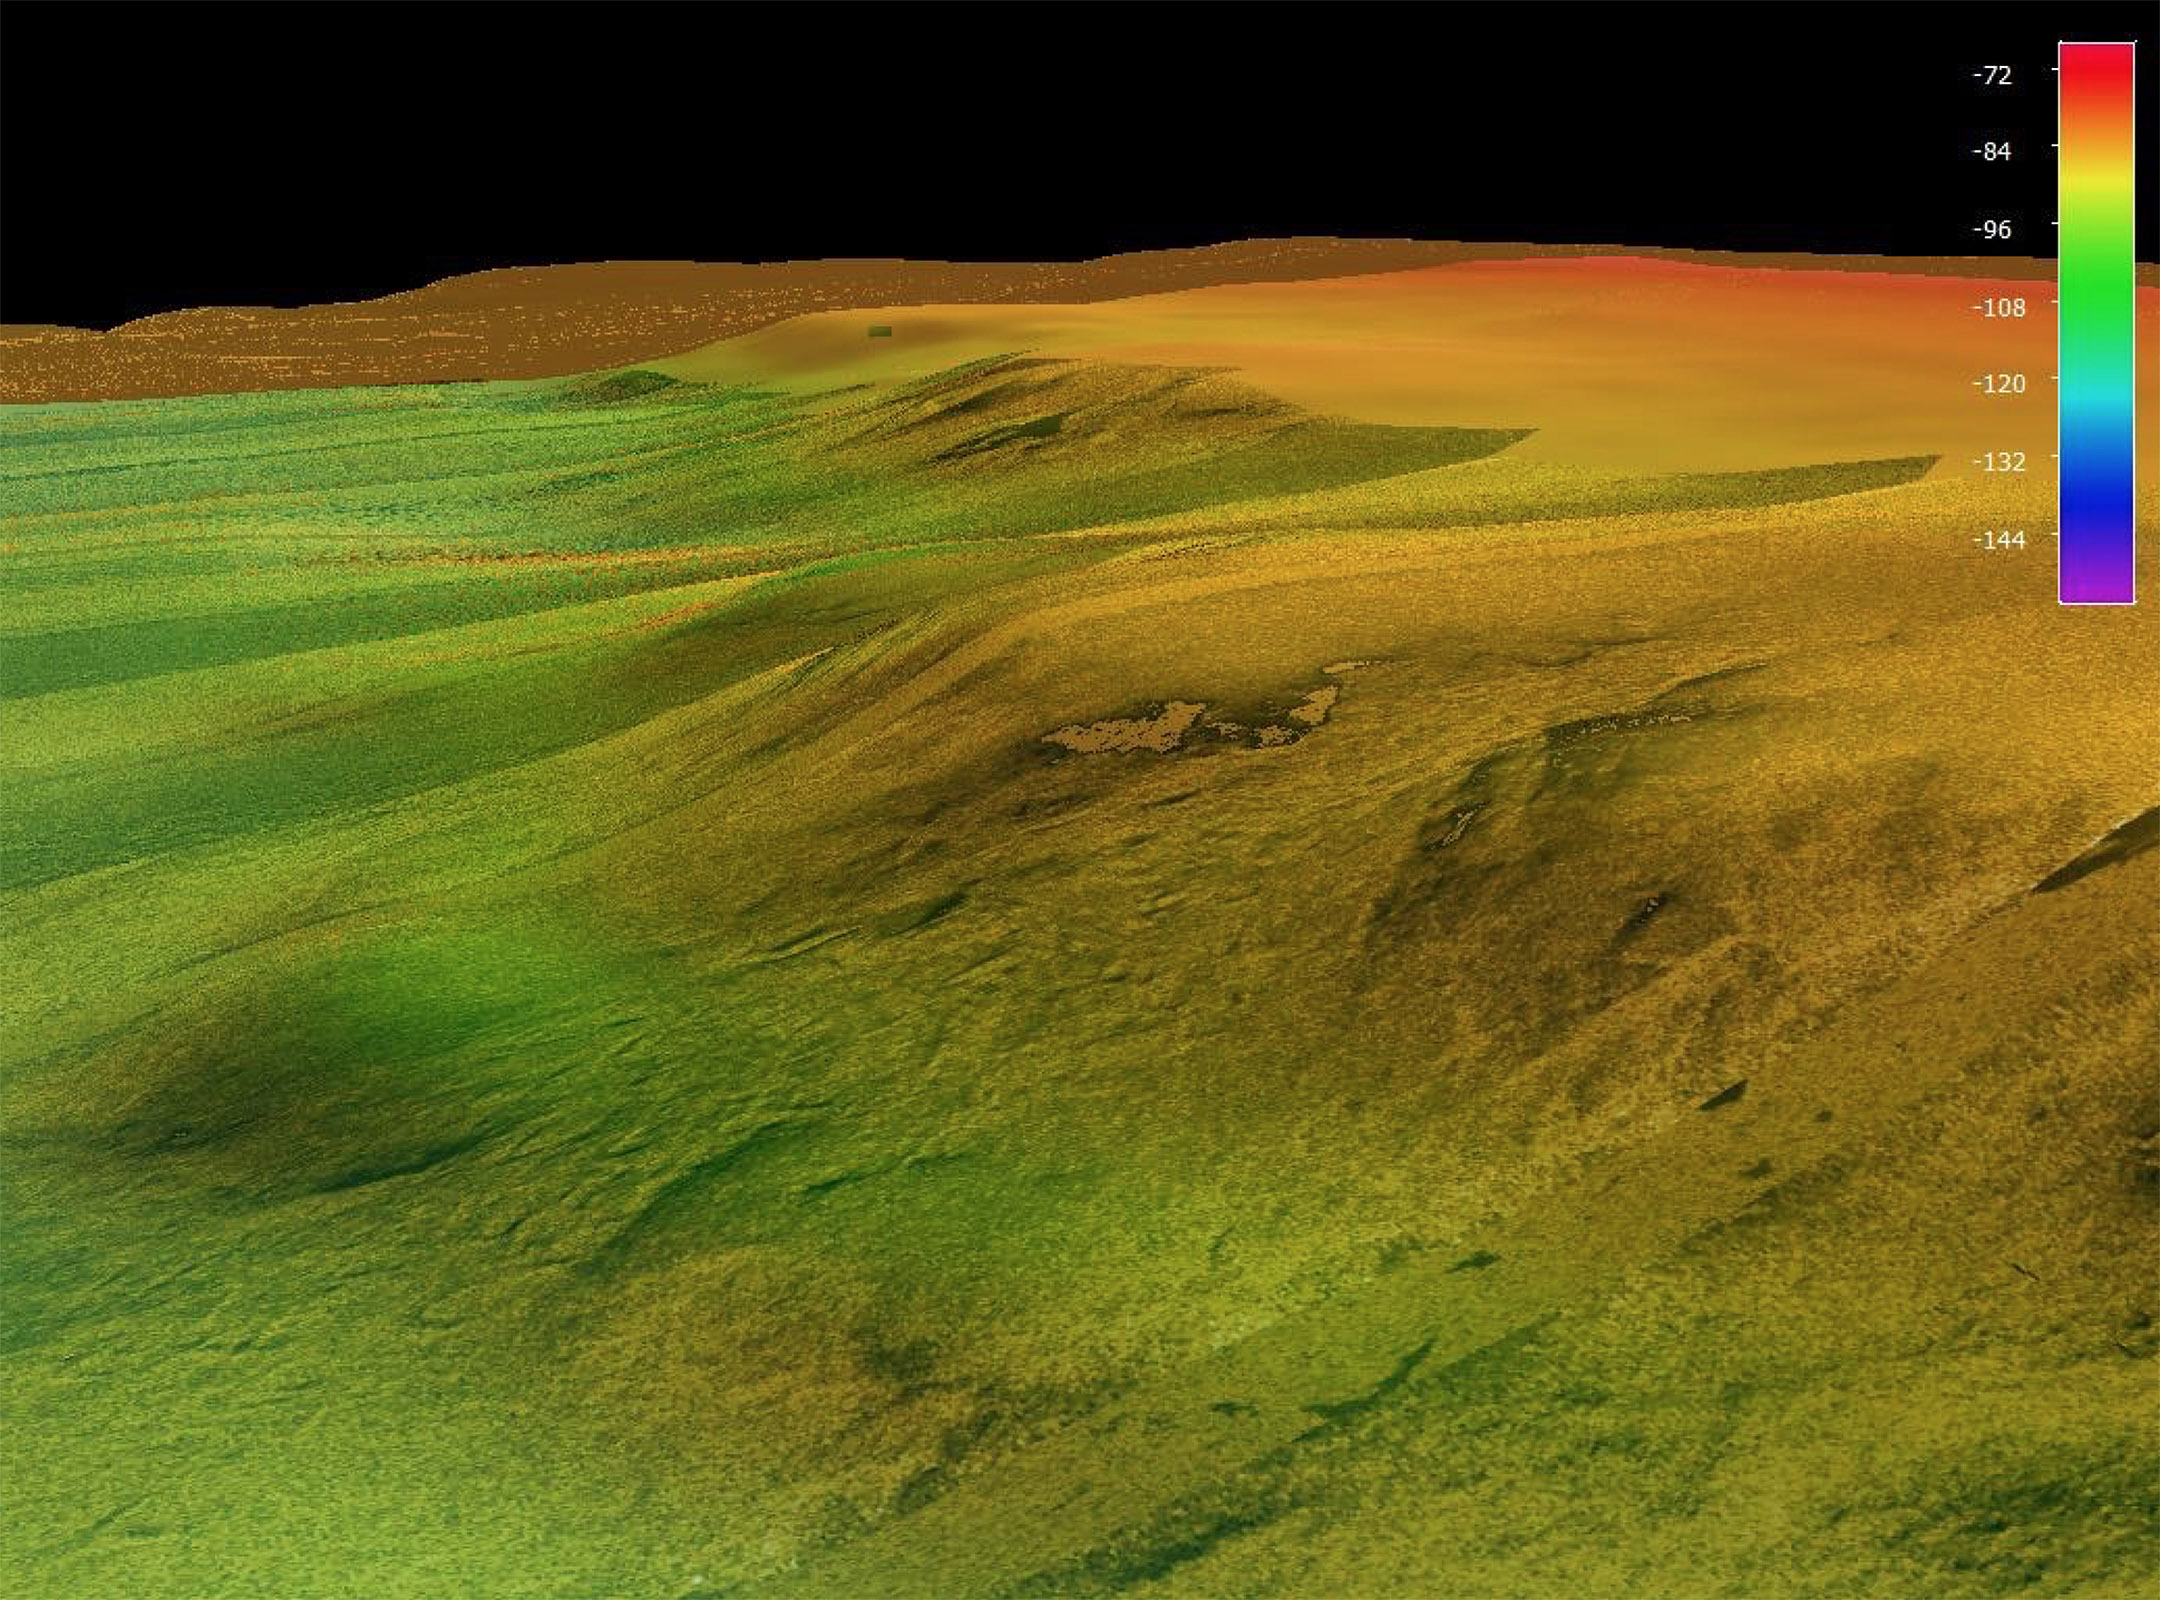
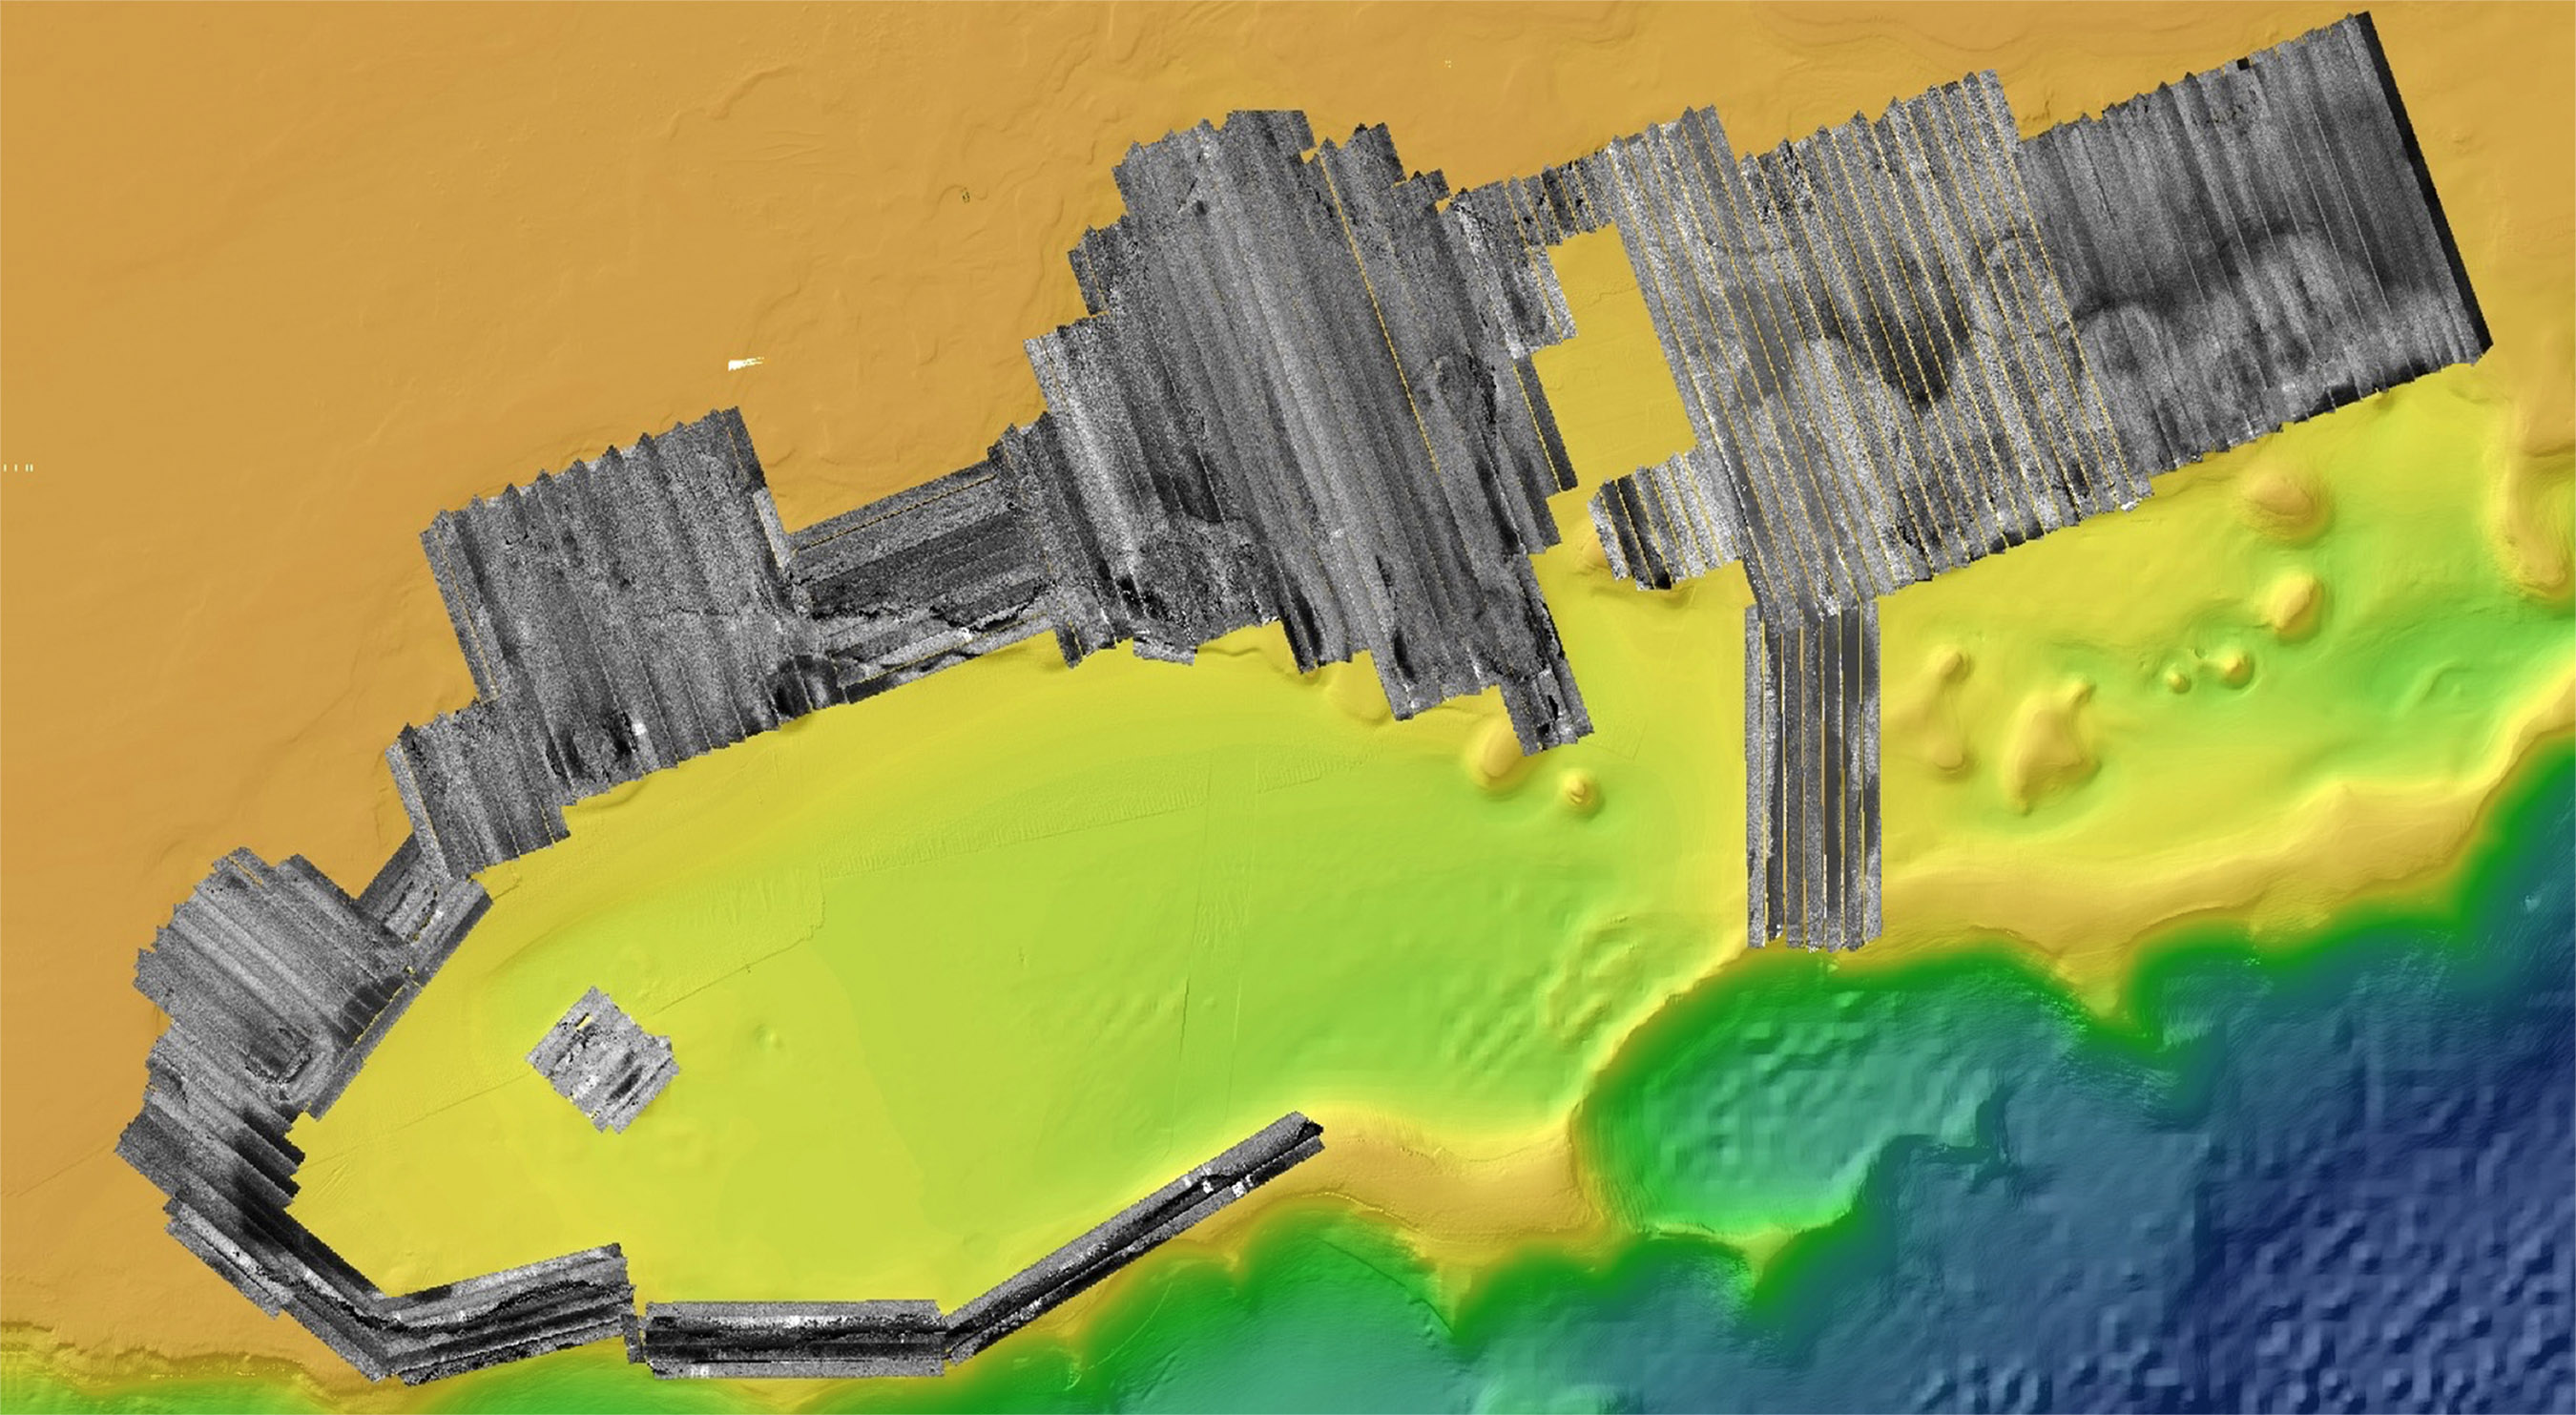
On this cruise we are using two main instruments: R/V Falkor’s hull-mounted 70 kHz multibeam sonar and the 200 kHz sidescan on WHOI’s Remus 600. Why do we need both? Well, remember that our reefs are submerged at the depth of the coast during the last Ice Age, 100-200 m. A higher frequency sonar can resolve more detail, but is not able to see as far through the water as a lower frequency sonar. This trade-off between map resolution and coverage area motivates us to use the nested mapping approach. The Falkor’s 70 kHz sonar pings from 100+ m, but each data point represents an average of a 1×1 m area. In contrast, Remus 600’s 200 KHz system pings the seafloor from a height of only 20 m away, and each data point represents a 0.25×0.25 m area, 16X better resolution than the 70 kHz. This difference is similar to the difference you can see from 1080p versus a 4K video. Although we can detect the major landforms of the reef with the Falkor’s sonar, in order to connect the sonar data directly to the coral types, we need the higher resolution of the Remus 600 sonar to start to resolve at the scale of individual coral heads.
Combining Products
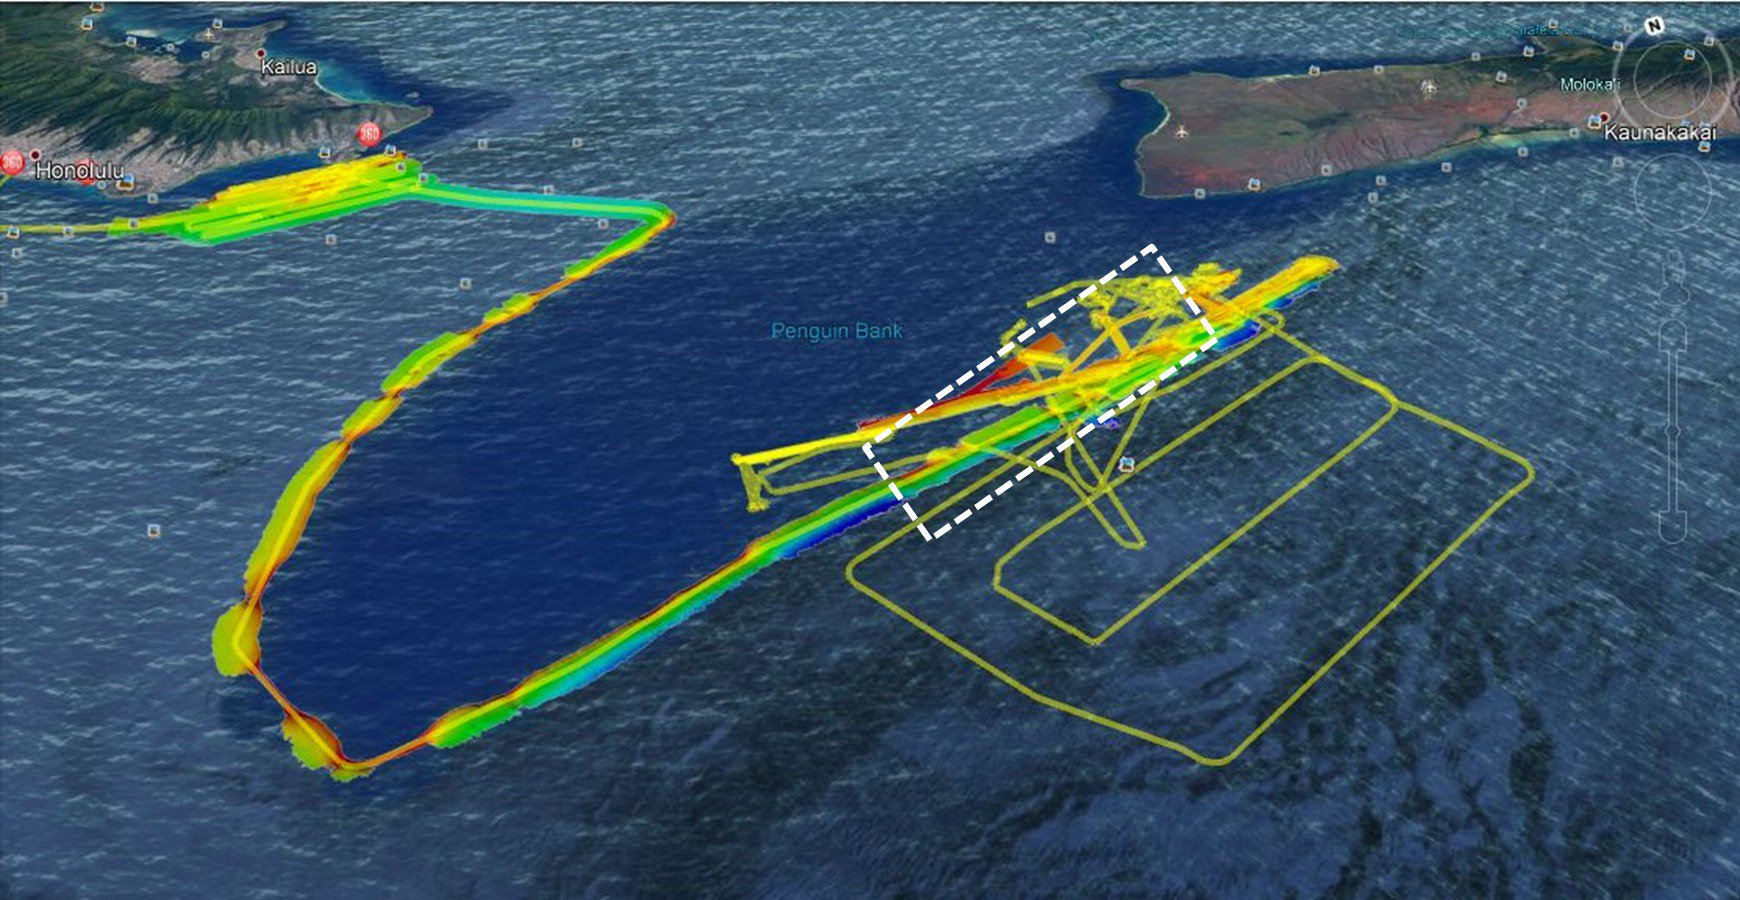
We map the whole reef system with the Falkor’s sonar, and use the Remus 600 in more targeted areas where we want to gather key pieces of the puzzle to put the Falkor’s data into context. Remus 600 also carries a digital camera that we use to take pictures of the seafloor in a few highly select spots. Of course, photographic coverage of the seafloor is necessarily very limited by time and field-of-view. Armed with these maps, the scientists on Leg 2 of this cruise will use Remotely Operated Vehicle (ROV) SuBastian to select the most interesting dives, maximizing our dive time and getting samples and video that we then will use to convert the sonar maps into maps of coral types and finally reveal the secrets of the ancient Ice Age reef.