My name is Alysha Johnson, and I am a PhD student at the University of Wollongong at sea on the R/V Falkor. Not only did I finish 30 days at sea on the previous cruise, Pinging in the New Year, but I was also offered the chance to come back on board for the current voyage, extending mapping through the Tasman and Coral Seas! Being surrounded by enthusiastic people aboard the R/V Falkor has given me an exceptional opportunity to learn new skills and grow as an early career researcher. Specifically, hands-on experience of collecting multibeam data and discovering the seafloor has allowed me to integrate our findings into my PhD project.
During my time as an undergraduate and honours student at the University of Auckland, I developed two primary interests: igneous geochemistry (using chemical changes in volcanic rocks to understand how magma moves through the Earth’s crust) and coastal geomorphology (looking at the shape and structure of coastlines to understand how they erode and evolve). When contemplating what I wanted to do for my PhD, I strived to find a project that combined these two interests. And I did! I found a PhD studying volcanic island geomorphic evolution, which is about understanding how the shape of a volcano or seamount in the ocean changes over millions of years. So, from a seamount under the ocean erupting to form a volcanic island, finally eroding, and sinking beneath the surface to create a guyot.
Here on the R/V Falkor, my role is to assist with the multibeam data collection. I supervise and monitor the data collected by the EM 302 multibeam system as we sail along. The multibeam operates by sending a sonar pulse or a ‘ping’ made up of 432 beams out to the seafloor and then ‘listens’ to hear their return after reflecting off the seafloor.
Based on the length of time it takes for each beam to rebound – and the knowledge of the sound velocity profile of the water column through which the beams travel – the depth of the seafloor can be calculated. Sending and receiving ping after ping as the ship glides along builds a 3D bathymetric map of the seafloor made up of numerous depth soundings.

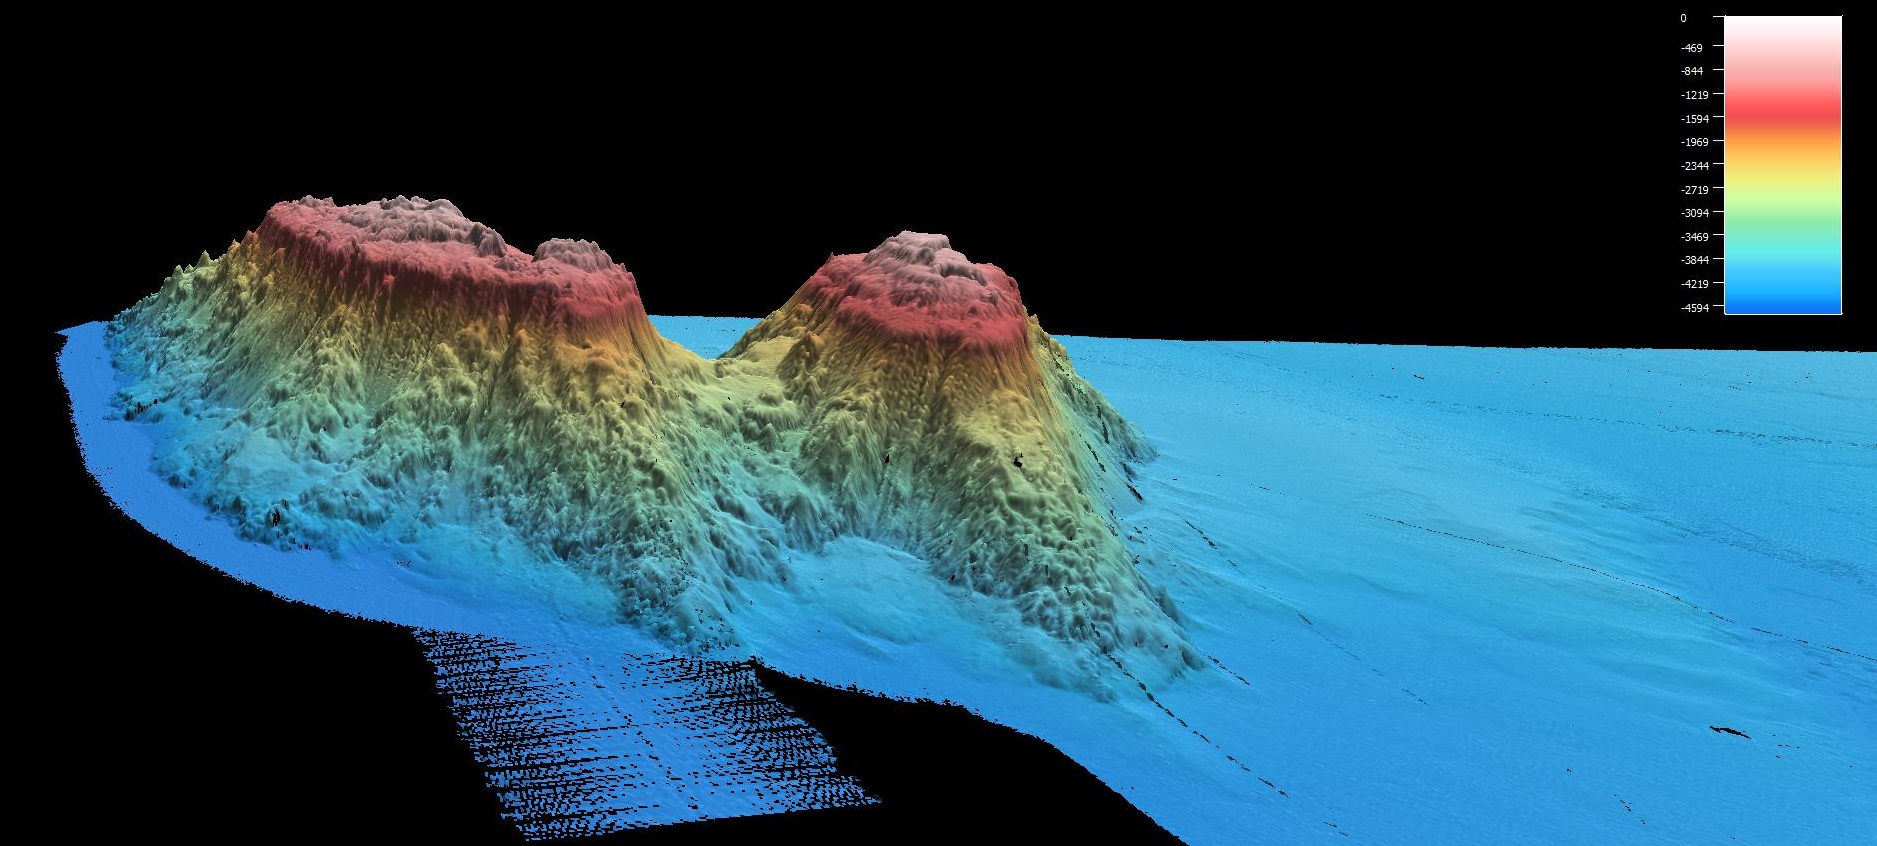
On the previous cruise, we mapped over the Recorder and Fraser guyots that are part of the Tasmantid Seamount Chain. I have started to look for features such as terraces which might tell me where surface wave erosion happened in the geologic past from the bathymetric data collected. We have also found evidence of mass wasting and landslides. Here, the flanks of these volcanoes have collapsed, leaving erosional chutes and sediment lobes at the base of the seamounts.
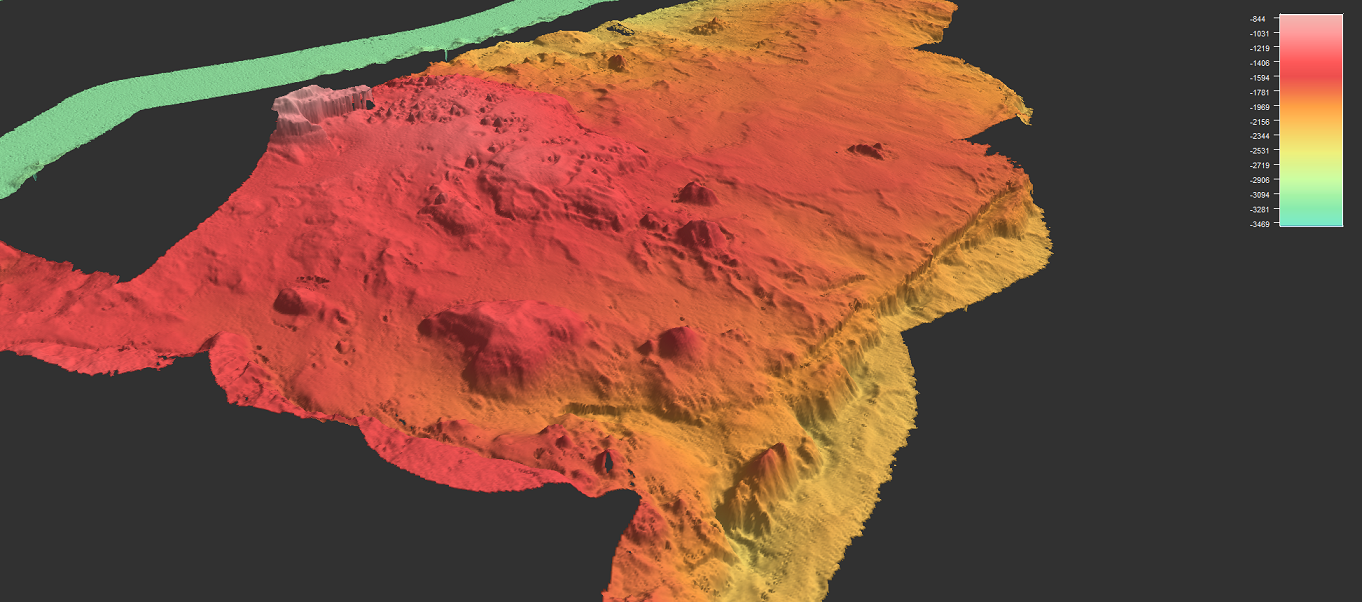
On this present cruise, it has been exciting to sail farther north to explore the geomorphology of Wreck and Kenn Reefs. These reefs lie at the northern end of the Tasmantid seamount chain and are made up of volcanic bases and carbonate tops. This means that wave erosion and periodic growth of reef and carbonate have combined to form their current geomorphology. One question that has already come from our investigations is: Where does the volcanic base stop and carbonate growth begin? Further, at the deeper bank extending out from Kenn Reefs, I have been able to identify a fault line and am eager to investigate how this may have influenced its geomorphic evolution.
Using my volcanism and coastal geomorphology background, I will be trying to reconstruct what happened to the Tasmantid Seamount Chain to create its modern morphology. While on the R/V Falkor, my ideas have been theoretical, but at the end of this 62-day adventure, I will begin to process the bathymetric data collected and look for signals that could help answer these questions. Many ideas have been sparked at sea, and while I spend my final two weeks surrounded by brilliant students, scientists, marine technicians, and crew, I am certain that I will have even more ideas to take with me ashore.