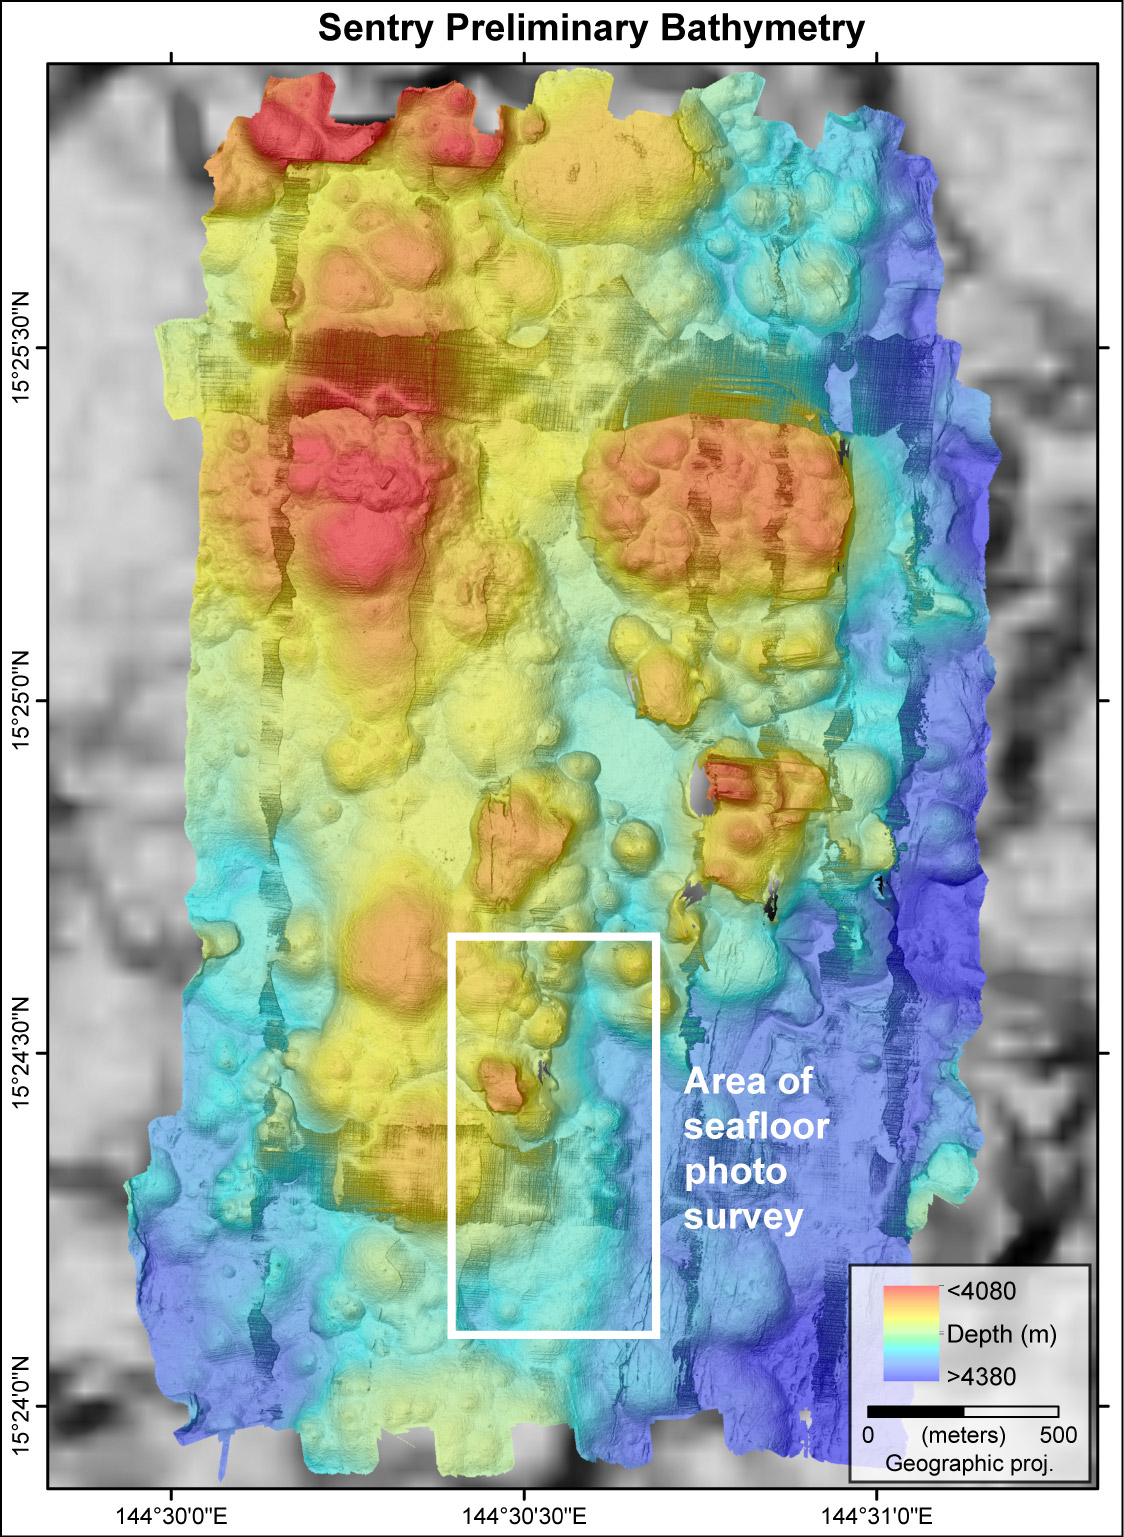
With the discovery of big plumes and active venting on the seafloor during CTD tow-yo 6 we really hit the jackpot out here on the Mariana back-arc. This led to further investigation of the site with the Autonomous Underwater Vehicle (AUV) Sentry. The result was a beautiful high-resolution bathymetry map [FK151121_sentry_bathy.jpg] and an even more-detailed photographic survey of the seafloor in the area of interest. To our surprise, the photo survey discovered a very young lava flow in the area where the CTD tow-yo indicated low-temperature venting. This led us to question: when was that eruption, and how big was it?
Doing the Math
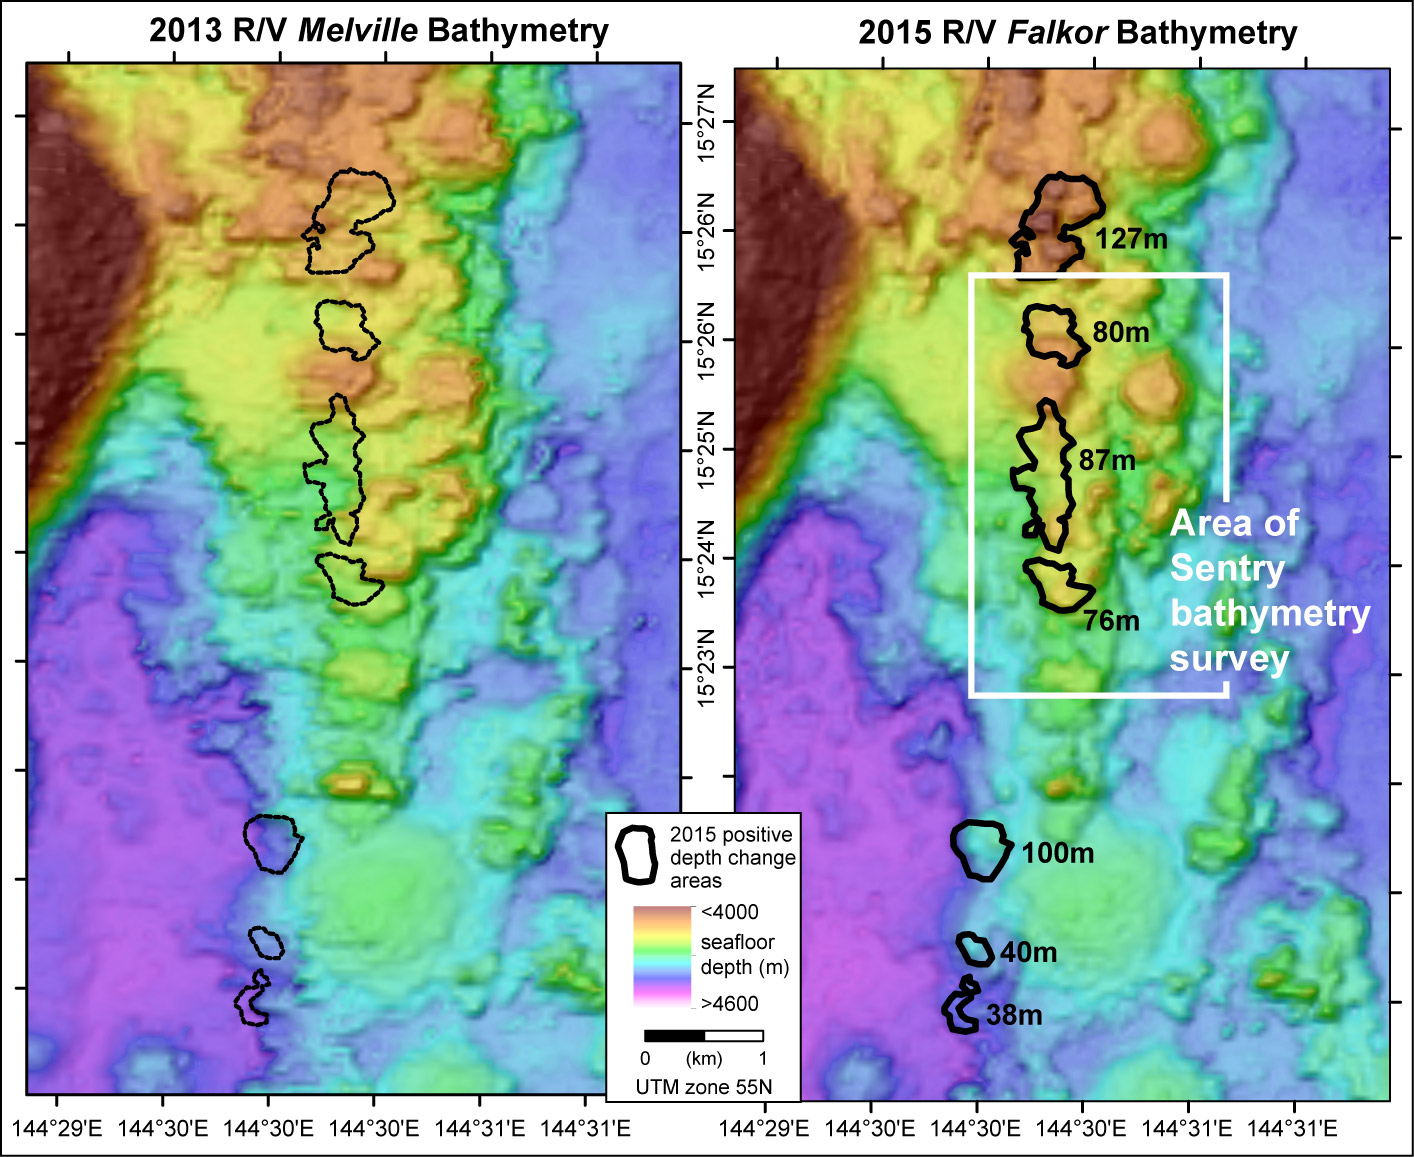
This is where mapping we have done with R/V Falkor’s multibeam sonar came into play. Sonar systems send sound pulses from the ship to the seafloor (called “pings”). Present-day sonar systems can provide up to 432 individual depth readings (“soundings” or “beams”) across each ping – this is where the term “multibeam” gets its name. The amount of time it takes each sound pulse to return to the ship indicates the depth beneath the ship: the longer it takes the sound to return, the deeper the water. Those depth soundings are pulled together to create a grid of the seafloor. Ship-acquired seafloor depth information is scarce and expensive to acquire, so whenever the opportunity presents itself scientists will collect sonar data – even if they have no plans to use it for their individual research. One aspect of my job is to compile all the ship sonar data collected in the areas where we work and pull it together into a database. Because of this, we have with us the multibeam sonar data collected on a previous cruise to this area in 2013 (by Patrick Shore and Doug Wiens on R/V Melville), and we’ve resurveyed the same area during this expedition. By performing a little bit of math, we can calculate the difference in the seafloor depths between then and now. The earlier grid (2013) is subtracted from the new data (2015) and depth differences in those grids show changes in the seafloor between now and then.
The Results
 Surface differencing is a quick way to show us where the new lava erupted on the seafloor, and we can also calculate the volume of new lava flows. The results reveal that the new lava flows extend over 7 kilometers from north of south, and that greater than 60,000,000 cubic meters of lava was deposited on the seafloor. The northernmost lava flow was the largest, with a volume of over 20,000,000 cubic meters, piling up pillow lavas over 125 meters (400 feet) thick. Now that’s the kind of math that I find incredibly exciting!
Fly-through movie over the new lava flows. The white polygons show the lava flow boundaries. The bathymetry data are vertically exaggerated two times. Movie by Susan G. Merle/SOI