After a bumpy night of sailing from Kahe (West O‘ahu) to the south of O’ahu and Moloka‘i, avoiding [most of] the roughest seas in the channel, we have arrived at our target eddy of interest – a cyclonic eddy (shown in blue) just North of Maui.

We have been tracking this particular eddy for several weeks (using satellite images of sea surface height), watching its formation and seeing how it develops in terms of strength and location over time. In the animated infographic on the left, the blue circles are cyclonic eddies, which have lower than average sea surface height at the surface. The arrow points to one we have tracked carefully that is developed into a strong eddy over the past month, and is heading north of Maui – even moving towards the University of Hawaii’s long term study site, Station ALOHA, just north of Oahu. Now we are on site, and the eddy is living up to its promise as strong circular ocean current. We are using several different instruments to track the ocean currents, and help us find the eddy center as it continues to move west.
Tracking Changes
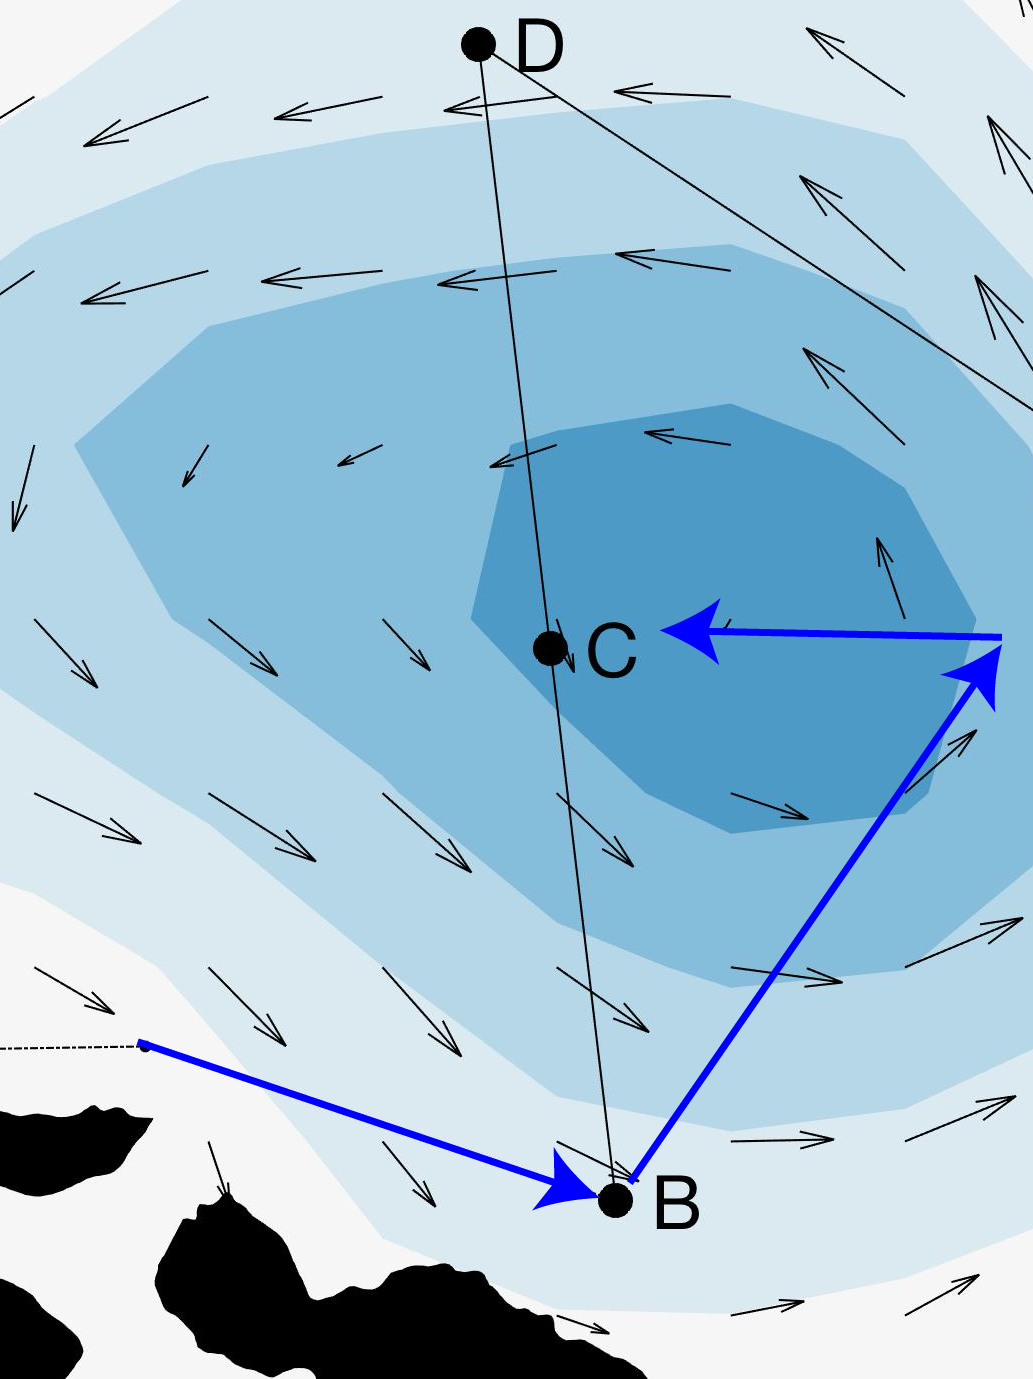
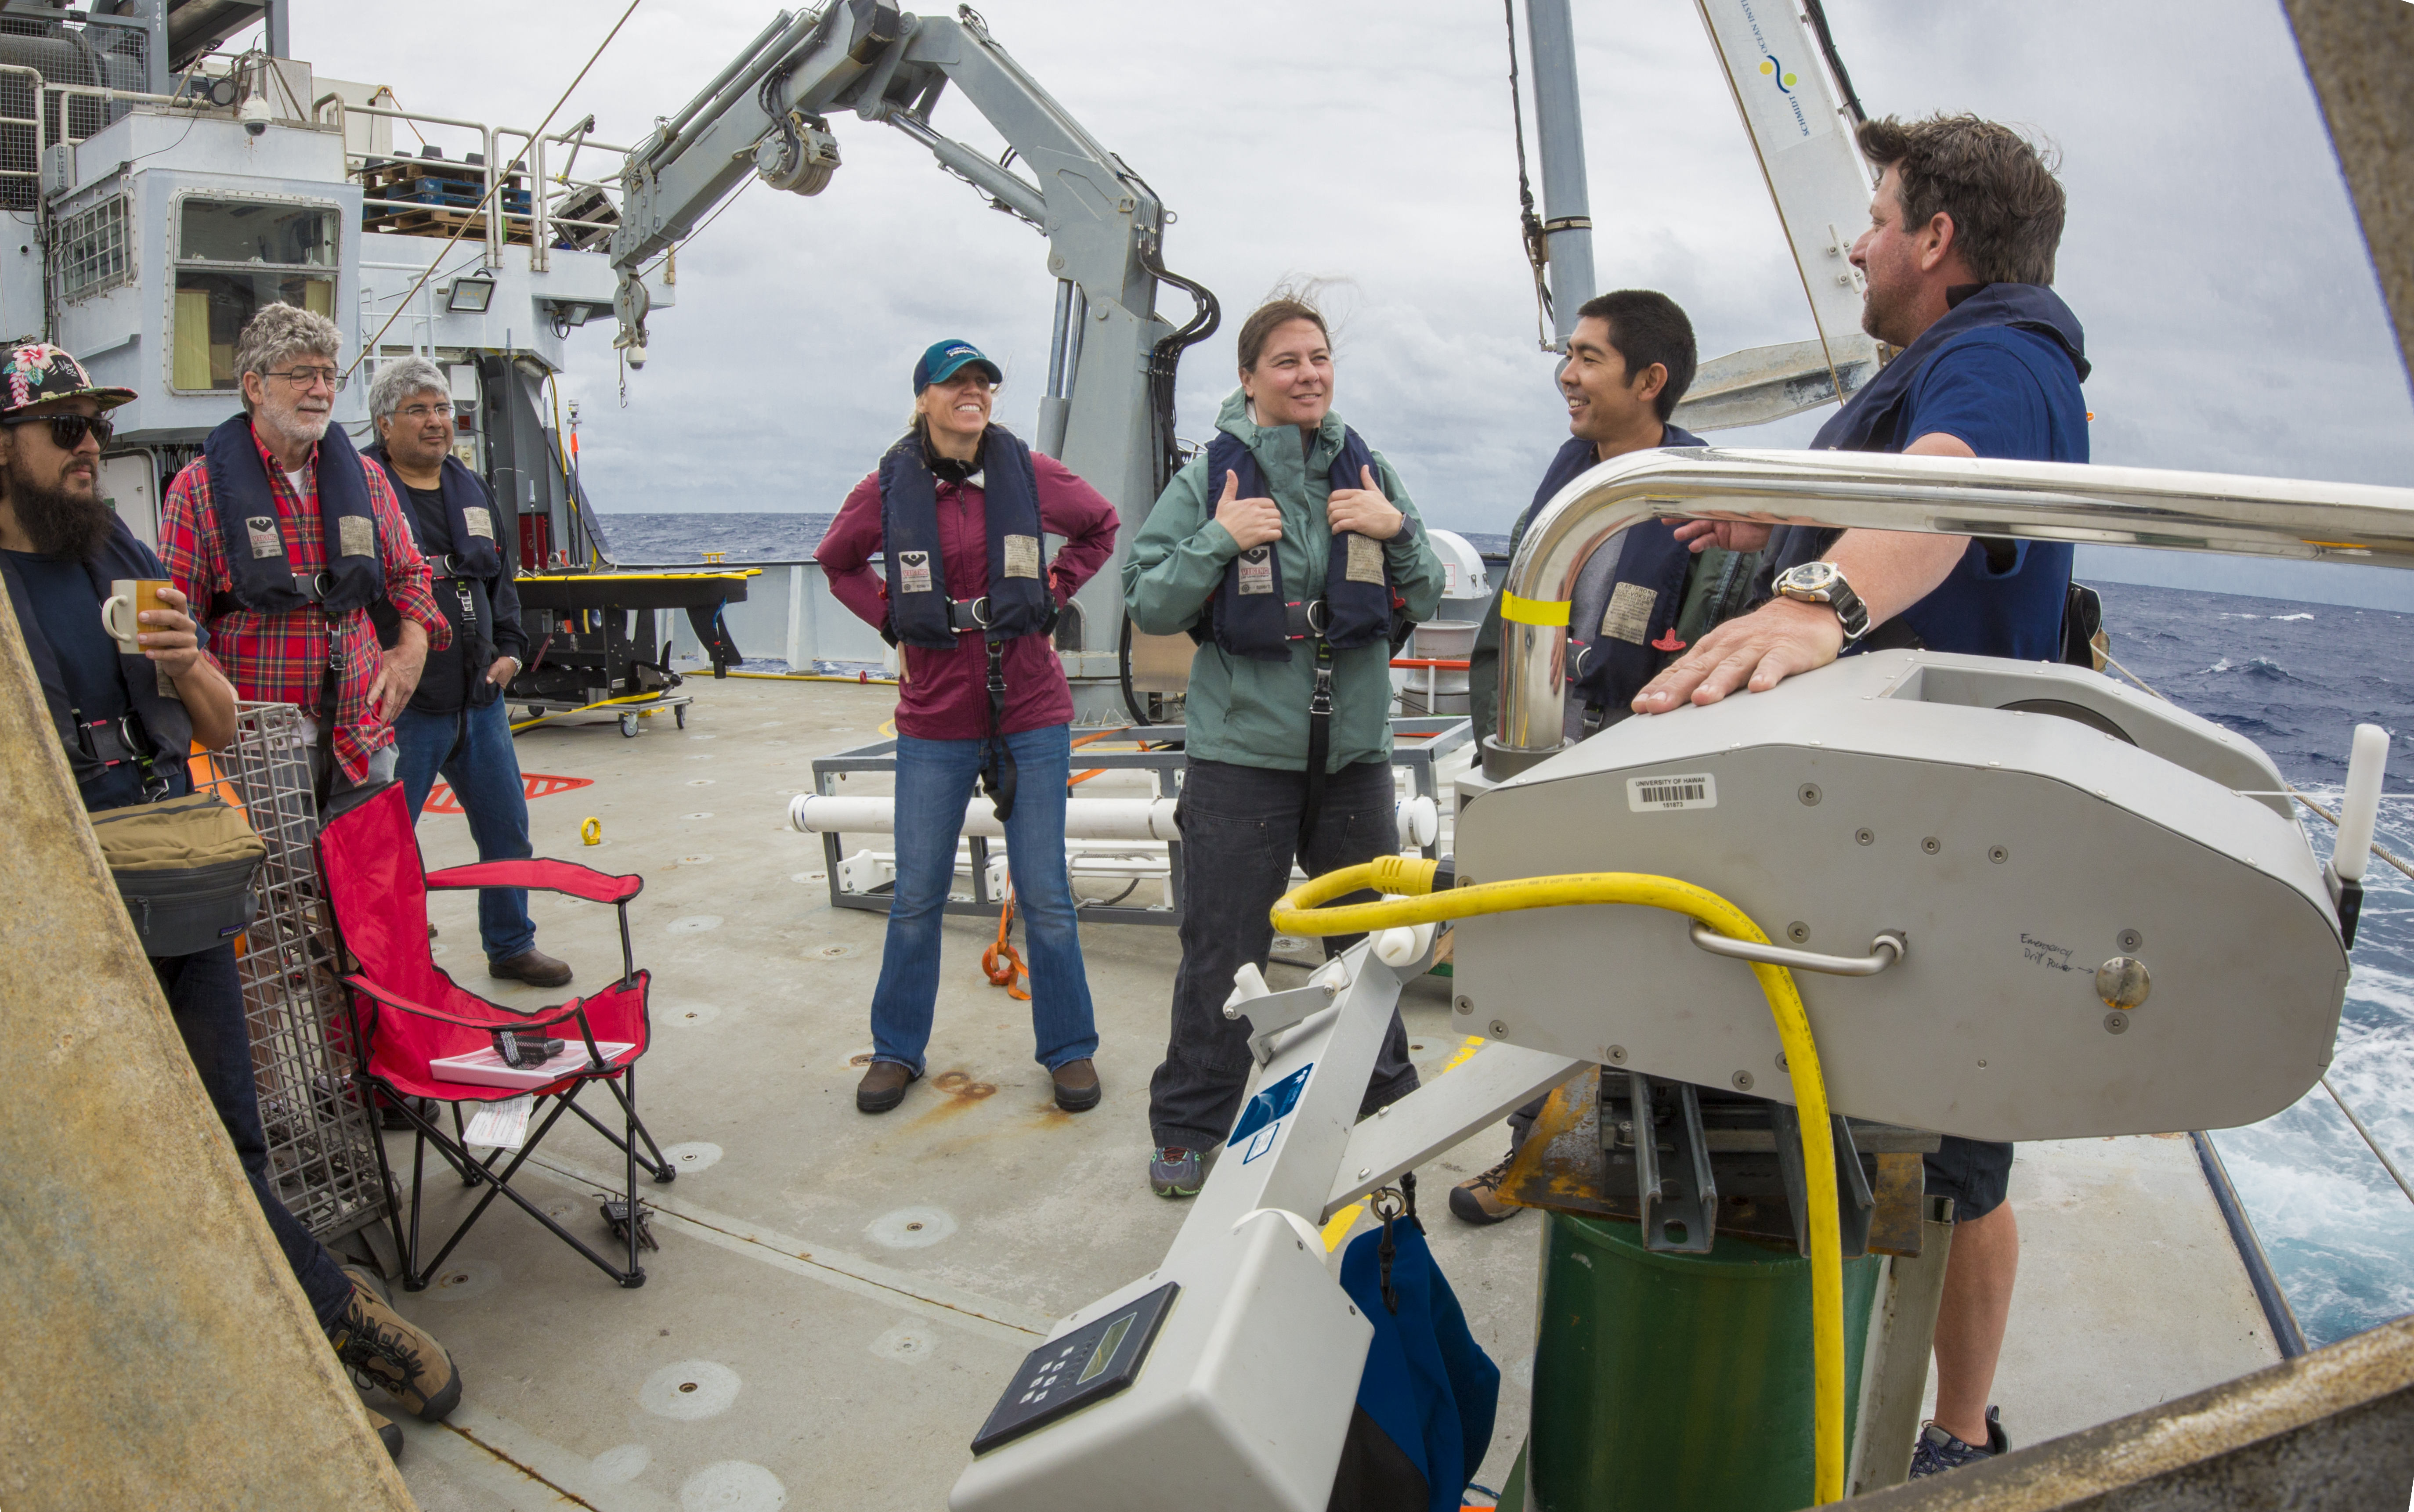
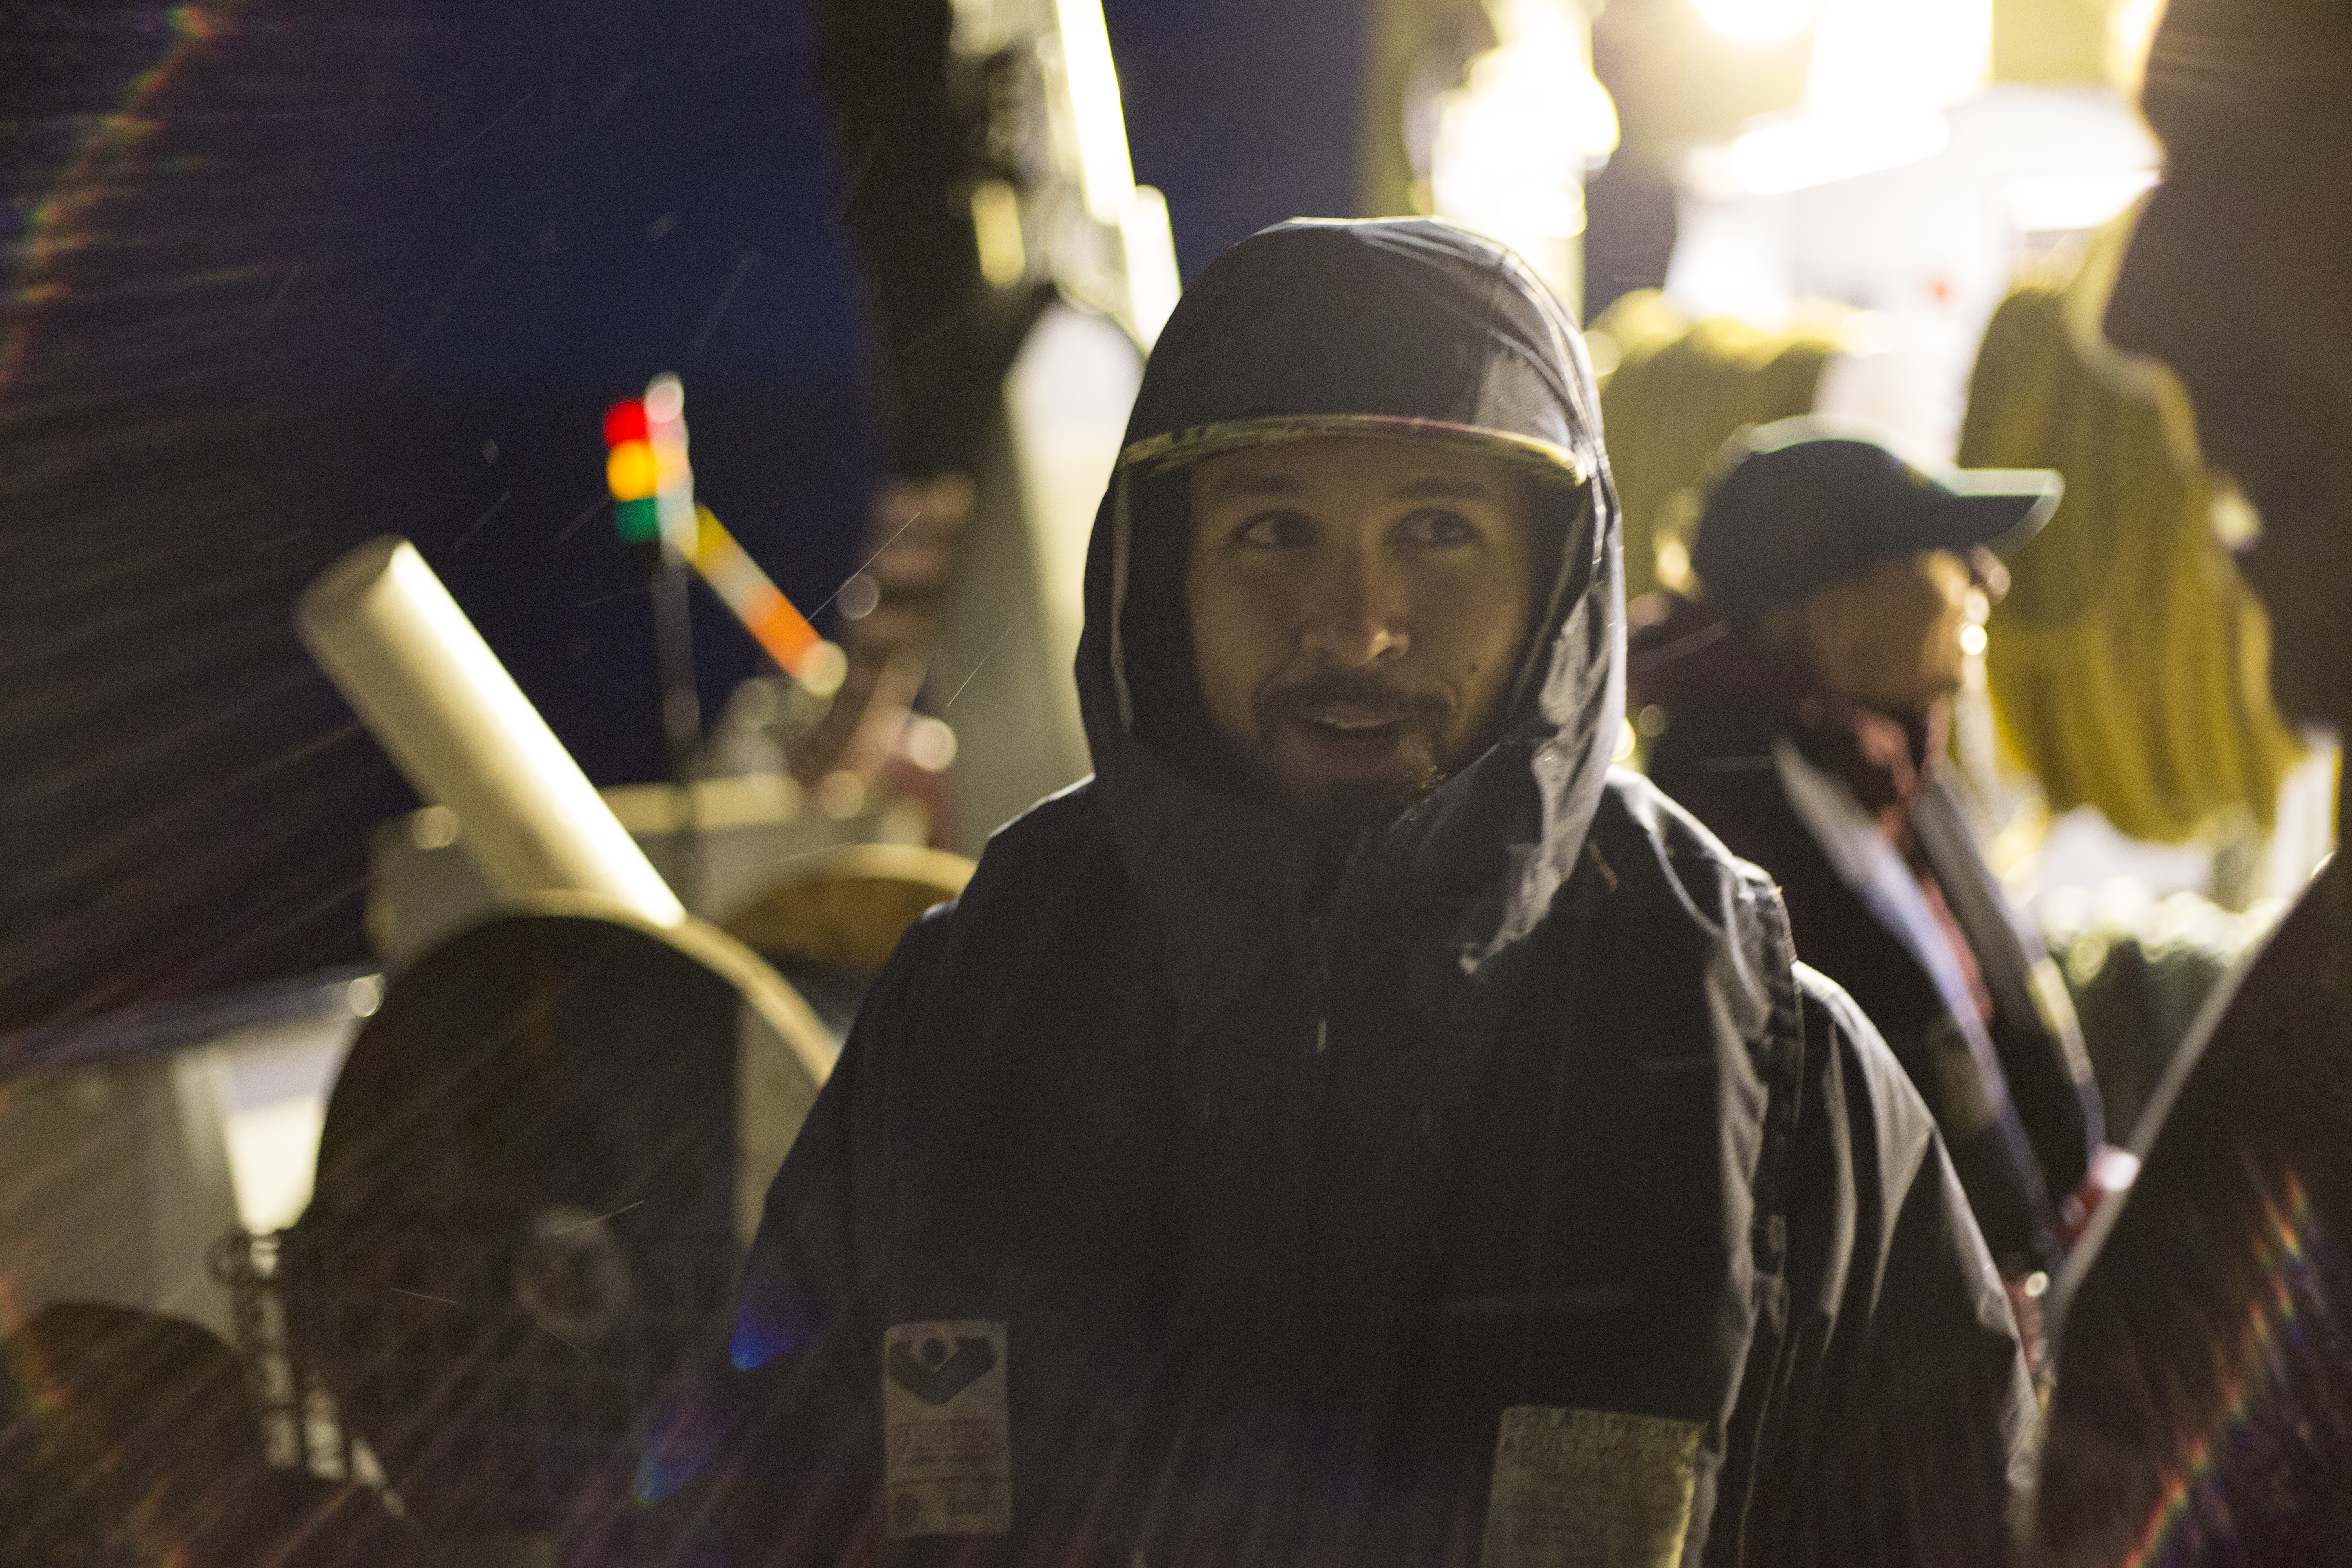
As we sailed across the Maui eddy, we were able to detect changes in current using R/V Falkor’s Acoustic Doppler current profiler (ADCP). A cyclonic eddy rotates counter-clockwise, so the ocean currents (arrows) were moving to the south-east as we transited from the north of Moloka‘i to position B (blue line). Once we found these currents, we knew we were on the edge of the eddy. We began to explore the eddy at depth with an underway CTD (Sensors measuring Conductivity, Temperature, Depth) and a team of scientists willing to rotate shifts (and brave the choppy seas) to cast and recover, then cast again, a CTD probe off the back of the ship.
Reading (and Using) the Data
Dropping CTD probes in the water whilst transecting through the eddy reveals what it looks like under the surface. The satellite data that got us here can only ‘see’ down 25 meters into the ocean, but eddies can reach hundreds of meters deep. The underway CTD (uCTD) sensor takes a vertical profile every 15-20 minutes down to 300 meters, looking for the thermocline – the transition from warmer to cooler water with depth – as we cruise across the eddy.
Meanwhile, real-time collaboration was happening back in the Falkor library as on-board scientists discussed the incoming data ADCP and uCTD with their colleagues back on land. After 5 hours, finally – job well done! The current vectors (arrows) had gotten smaller (position C), indicating we were in the calm center of the eddy. Time to radio the good news to shivering scientists working on the back deck; we had finally hit the bullseye, the eddy center!
In the center, where the currents are slack and the water is calmer, we deployed a surface drifter, which is basically a big wet sock that will stay in the center of the eddy so we can find it again. You can also find the eddy center (i.e., track the drifter) on this website.
 We will also finished another full CTD cast and collected some of the very first water samples on the trip. We will be back at the center later in the cruise, but to fully understand this eddy we will finish crossing it all the way to its northern edge (position D). In our next blog, we will explore what we find when we get to the other side.