From the heart of the cyclonic eddy, we turned the Falkor north and cruised to its edge. We found the counterclockwise spinning cyclonic eddy. Now it is time to characterize the eddy’s physical, chemical, and biological features, which means it is time to get the LRAUVs (#MicrobeEddyBots) into the ocean and put them to work.
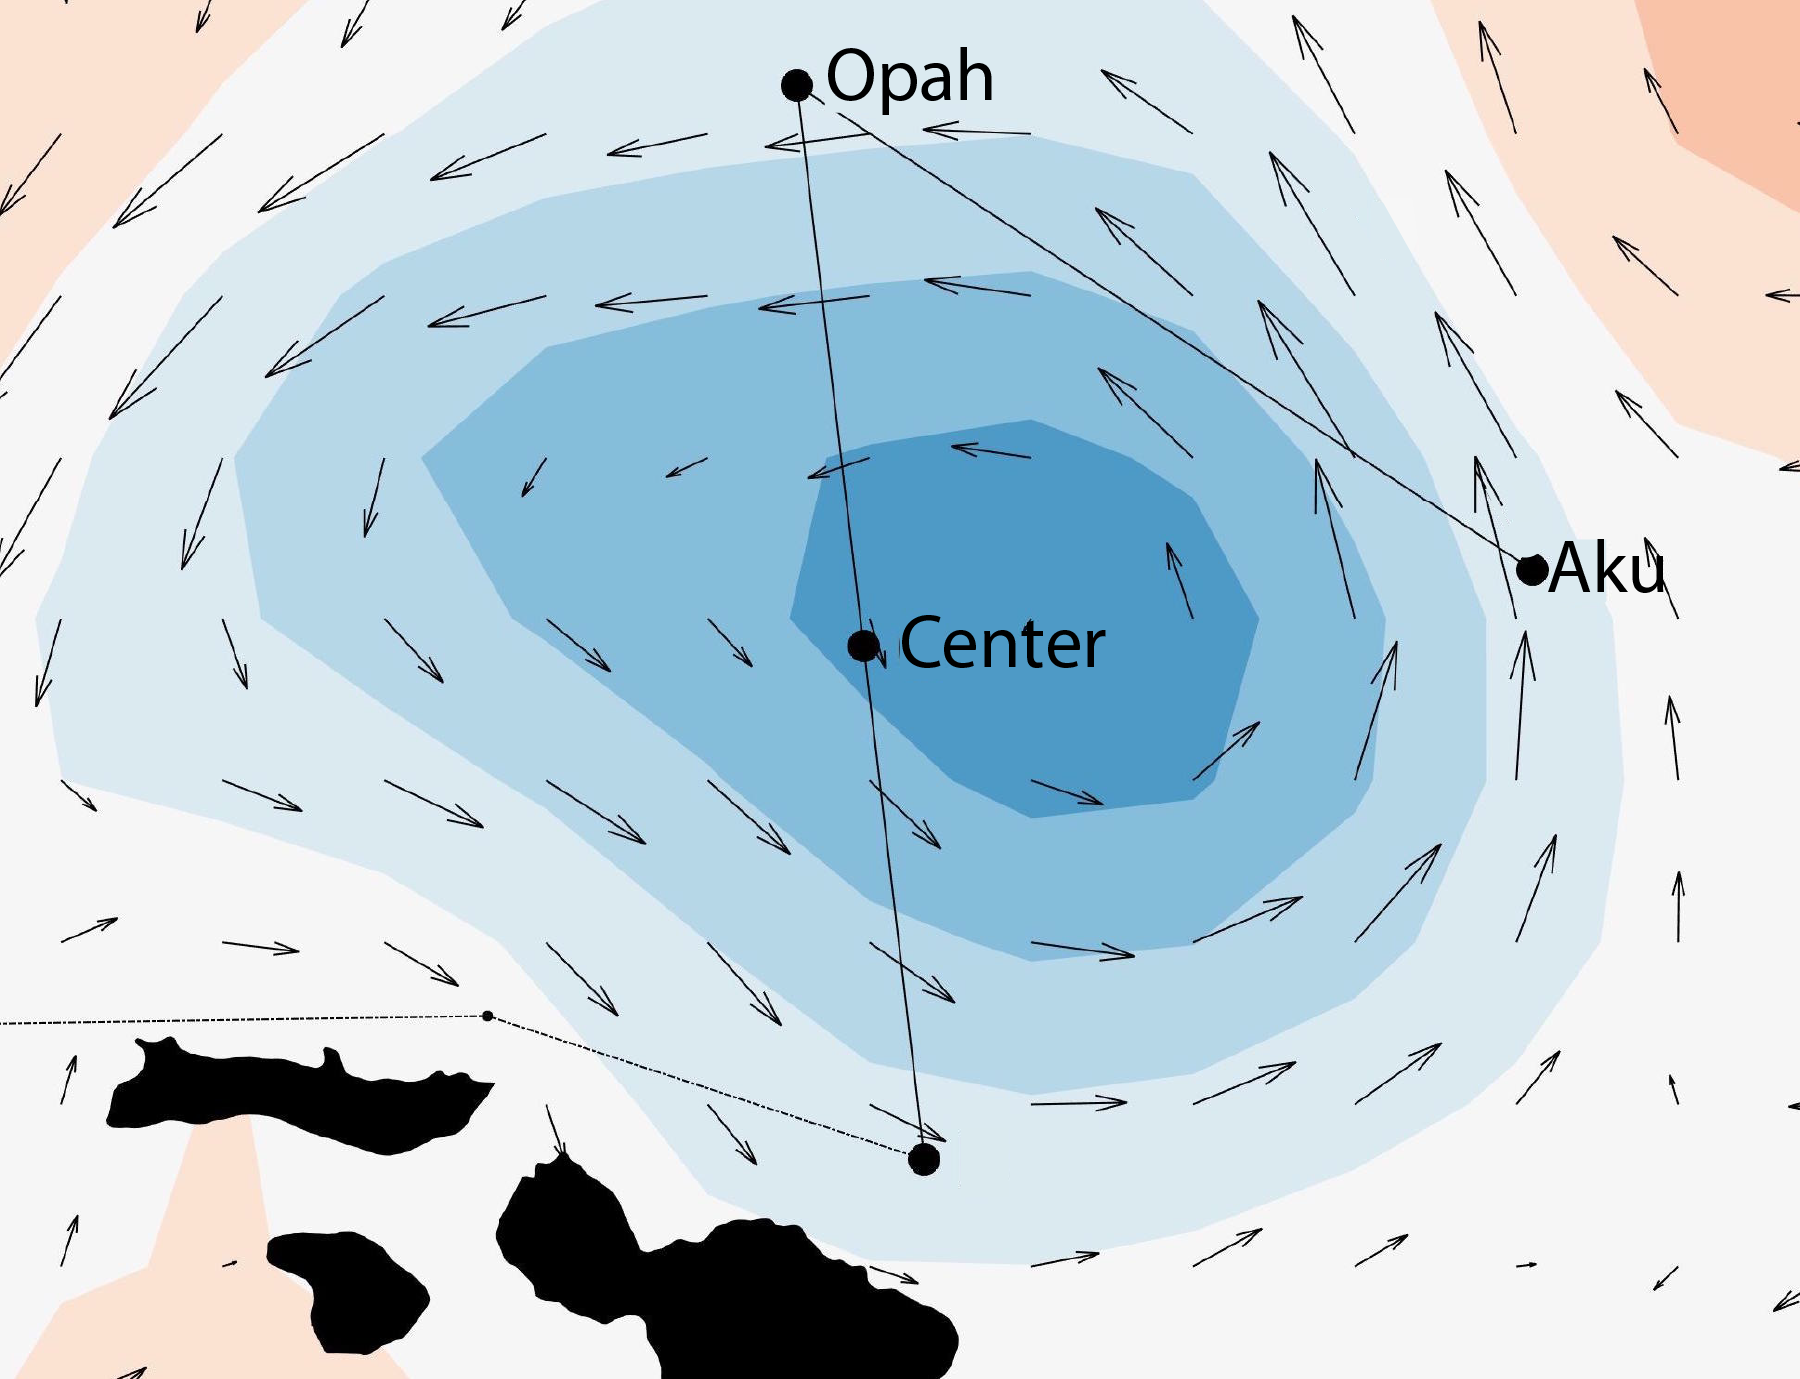
The eddy current vectors on the map show direction and velocity. These are derived from data collected by satellites, which circle the Earth at high altitude, and relay information as they pass over the Pacific Ocean – like a planetary cell phone circuit. In order to confirm that the eddy has formed as we might expect, based on the satellite data for the surface ocean, we’ll need to characterize the underwater features of the eddy, where the satellites can’t see.
Launch the Long Range Autonomous Underwater Vehicles!
Opah and Aku, our LRAUVs, are mapping the eddy by conducting vertical profiles. Yoyo-ing up and down from the surface to 250 meters in a zig-zag pattern, they are recording features like depth, temperature, chlorophyll, and salinity. To better map the whole eddy, we released Opah at the northern edge, and Aku on the eastern side. They spent 30-40 hours traveling from the edges of the eddy to meet back up with us in the calm currents at the center. The Underway CTD from our last blog post had already outlined many of the features helping confirm we were in the center of the eddy, but the LRAUVs can tell us more. They also detect chlorophyll fluorescence, which is a key indicator that the tiny microbial plants (the forests of the sea – phytoplankton) are present and active.
As with plants on land, the photosynthetic process of fixing carbon dioxide (CO2) to make biomass requires light and nutrients. In the magnificently clear tropical waters around the islands of Hawai‘i – and globally at lower latitudes – light is plentiful but nutrients are often limiting. In these regions of the ocean, we typically see two increases in chlorophyll fluorescence: one at the surface where light is plentiful, and another one deeper in the water column that we call the “deep chlorophyll maximum” (DCM). The DCM forms at greater depths with just enough light left to fuel photosynthesis, where the phytoplankton increase their chlorophyll content (which serves as their light “antennas”) so they can capture as much of the dwindling light as they can. In some eddies, it is possible for the DCM to move closer to the surface and become more productive, because the eddy itself can push nutrients up from deeper waters. In cyclonic eddies like the one we are studying, we predict there will be an upwelling of nutrients, a shallowing of the DCM, and larger amounts of phytoplankton.
 Map of the cyclonic eddy (blue area) north of Maui with Opah and Aku tracking to the eddy center to meet the Falkor (red diamond). The map moves to show chlorophyll values (blue = low, red = high) at the deep chlorophyll max (DCM). Graphic by Fernanda Henderikx (SCOPE) and Thom Hoffman (SOI).
As Opah and Aku move closer to the eddy center, we are exploring the chlorophyll signal from surface to 250 meters. At the edges, the DCM appears just below 100 meters, and it appears to get more shallow as the LRAUVs get closer to the Falkor (triangle with dashed line to show center of the eddy at depth).
After a day of chasing this eddy, then a day or two of surveys and exploration, we now can see many of the characteristics we expect for a cyclonic eddy: counterclockwise rotation, calm currents at the center, and very strong DCM that is nearer to the surface at the eddy center than at its edges. Success! We have identified a “textbook” example of a stable cyclonic eddy that we will explore in greater detail than ever before possible, thanks to the Falkor and its crew, the scientific team at sea and ashore, and of course the trusty LRAUVs and other instruments.
Friday morning, 16 March 2018, we switch the LRAUVs from survey mode to tracking mode. They will be sent new missions: to find the DCM signal around the eddy center, lock on, and start sampling phytoplankton and other microbes in the DCM. Up next, how do they actually track and sample?