It has been a surreal experience to gain glimpses into how the seafloor looks, kilometers beneath the sea surface. It often feels as if I am looking into a realm beyond our own…
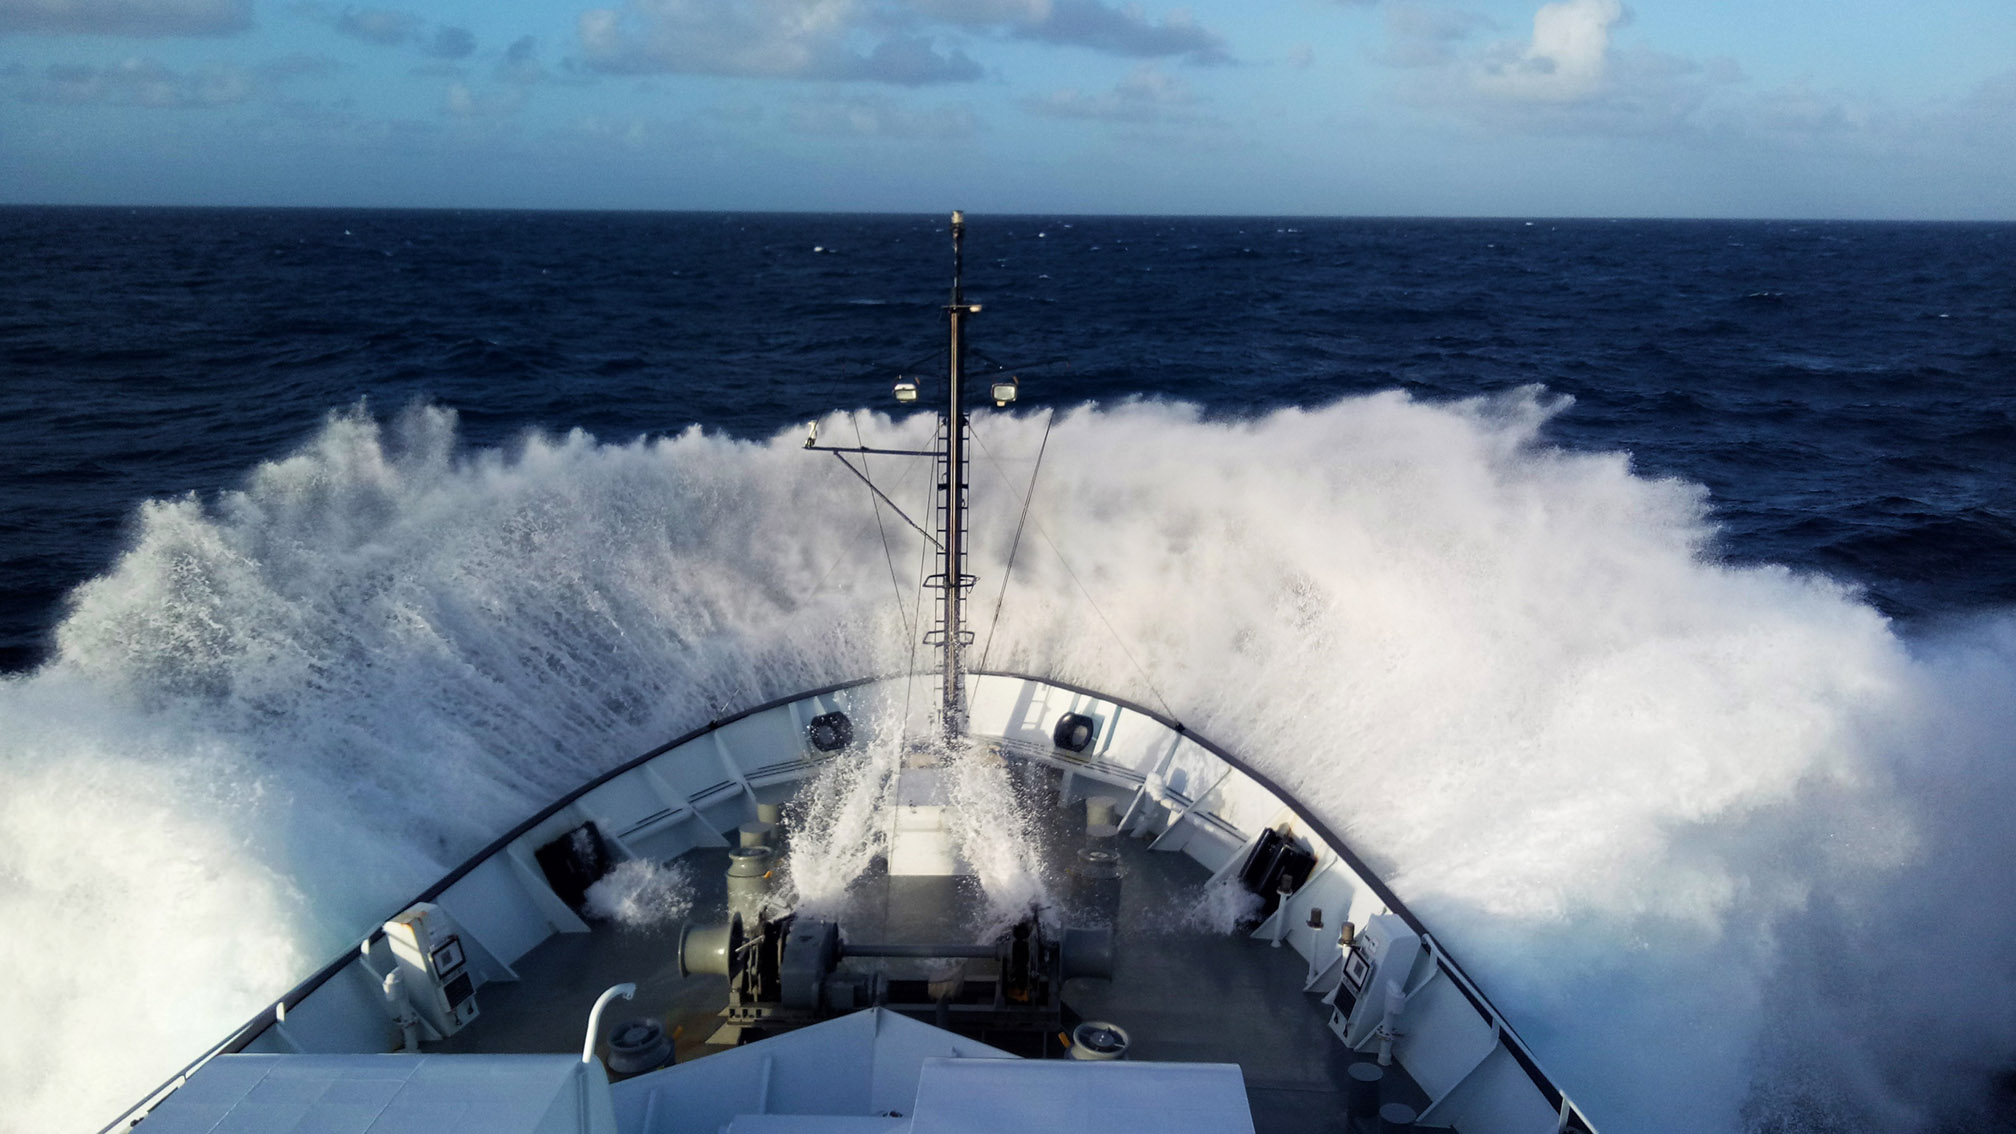
Hello from the Central Pacific! We have completed the mapping of the planned survey area around the Phoenix Islands Protected Area and are now on the homeward stretch north towards Hawaii. I am writing this blog while covered in a crusty layer of salt spray, as I spent the evening on the top deck watching the bow of the ship slam into 4-5m swells. Apparently, this weather is typical when just north of the equator due to the predictable trade winds, and so far it has been exhilarating!
From the Start
It sure has been a whirlwind of learning since being on board: I have been constantly immersed in conversation with the phenomenally experienced minds of Dr. Taylor and R/V Falkor’s marine technicians, Veit, John and Deb. The freedom to ask even the most basic questions has facilitated my learning immensely and it has been thrilling to watch seafloor data visualize and concepts play out before me during real-time data collection.
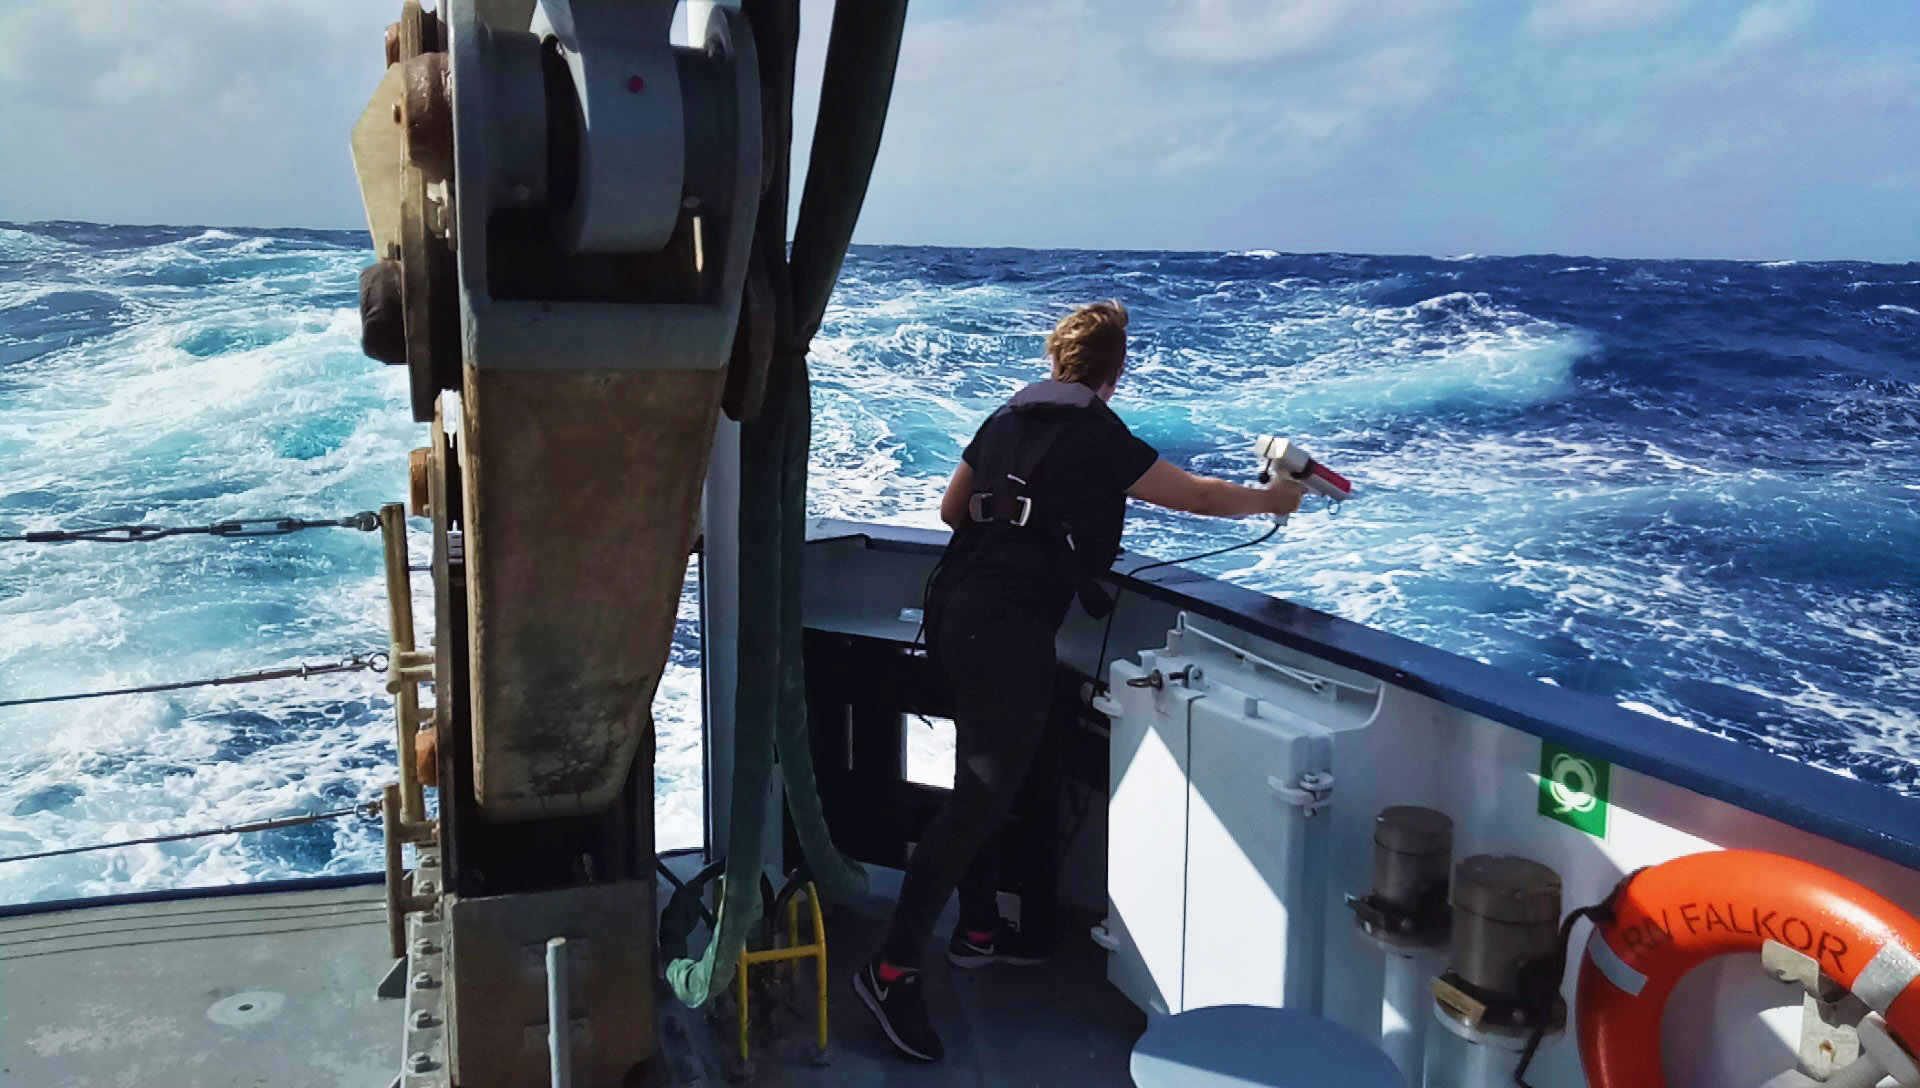
Plate Tectonics
The purpose of this research cruise is to use ocean floor mapping to unravel the story of how the previously adjoining Ontong Java and Manihiki oceanic plateaus separated and then came to be where they are today. This research is all about plate tectonics. Great! But what is that?!
The Earth’s thinnest outer shell is broken into segments, like the patches that make up a basketball. These segments are known as tectonic plates, and they move around the Earth’s mantle relative to one another, while shrinking and growing in size. The middle of these plates display little deformation. However, it is a different story at their boundaries. With the exception of mountain ranges, the majority of these boundary interactions take place under the ocean.
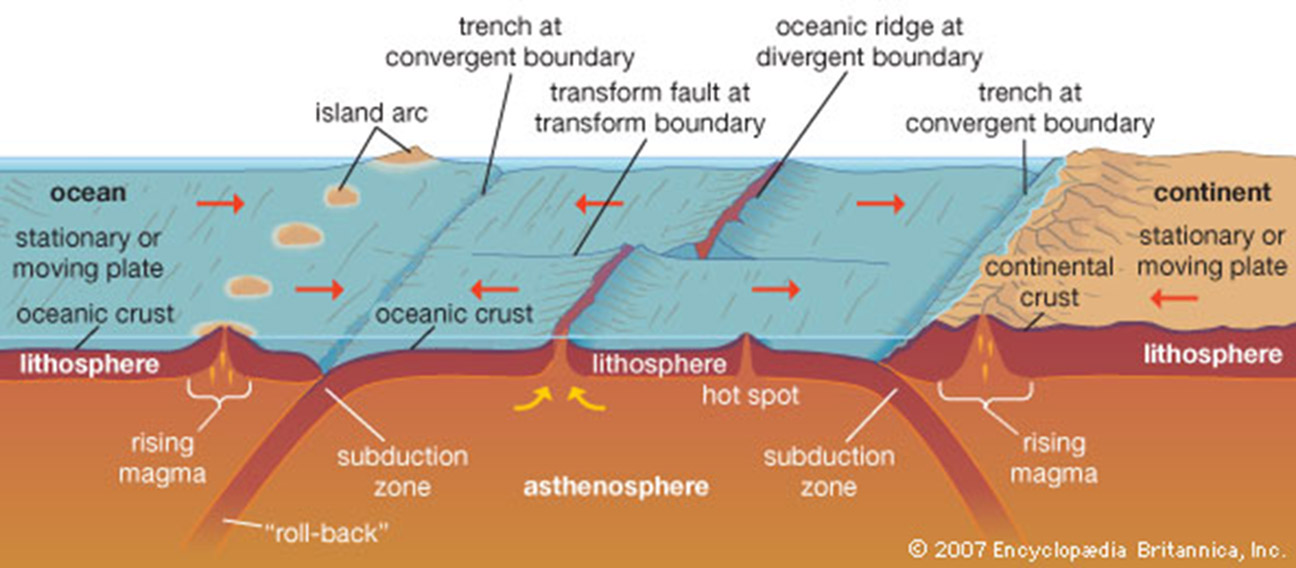
Generally speaking, there are three types of plate boundaries and each are identifiable by the way they deform the Earth’s crust:
1. Mid-ocean ridges are places that hot magma from the Earth’s mantle rises to and spreads, creating new oceanic crust and thereby pushing the plates apart. Over extremely long amounts of time, the oceanic crust cools, shrinks, and sinks deeper, creating a gradient away from these spreading zones.
2. Trenches form when two plates meet and one slides beneath the other, back into the mantle beneath the Earth’s crust – this process is called subduction.
3. Transform faults are a type of boundary where two plates grind past each other in a horizontal motion. Fracture zones are dead traces of formerly active transform faults.
Mapping Method
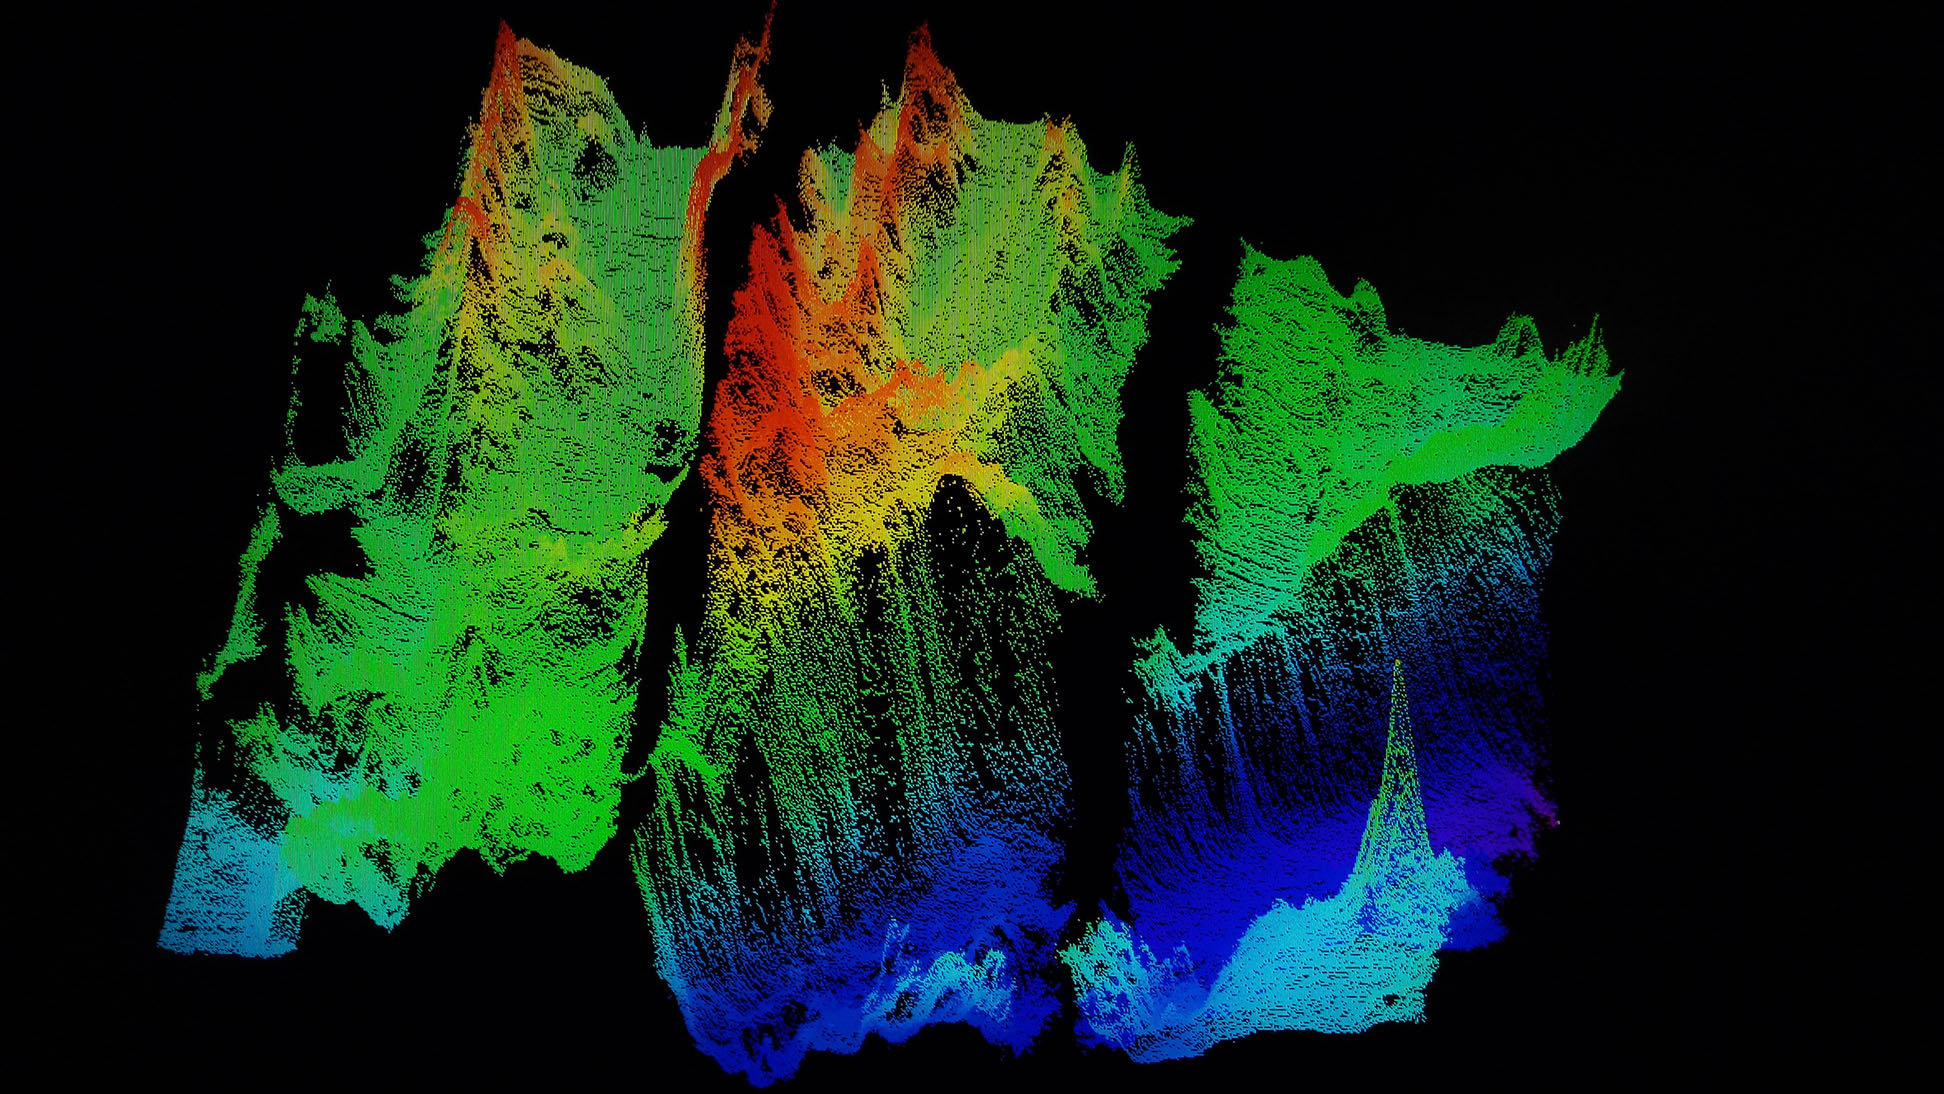
Mapping these features allows scientists to reconstruct the prior relative motions of the plates and propose theories that explain today’s formations. Multibeam sonar is a technology that allows us to paint a 3D picture of the ocean floor and identify these features. In a similar way to how dolphins are able to sense their environment using echolocation, multibeam sonar also uses pulses of sound to sense the depth of the seafloor.
The system that we are using is encased in a gondola beneath R/V Falkor and involves a linear array of 432 transmitters, each of which send out a short beam of sound at a particular frequency. The angle and time taken for these beams to reflect off the seafloor and travel back to the receiver under the ship is used to calculate seafloor depth for each beam. In about 5km depth of water this system can achieve a swath (side-to-side) width of 6km, and if each beam overlaps the next then the entire width of the swath is ensonified (or flooded with carefully-controlled sound waves), creating a high resolution 3D image of the seafloor.
This is all, in a nutshell, the premise of the work we are carrying out, and the ocean floor is more exciting than I could have ever imagined!
Schmidt Ocean Institute acknowledges and thanks the Republic of Kiribati and the Phoenix Islands Protected Area for their assistance and support of this research.