One of the first things we did once we arrived at West Mata volcano was resurvey the seamount with R/V Falkor’s multibeam sonar system. We knew from previous repeated bathymetric surveys that West Mata has had frequent eruptions during the last decade, as we shared in our last blog. The last survey was in March 2016, so we did not know what the volcano had been up to since then.

To look for changes between bathymetric surveys, we process the sonar data on a computer, using the two datasets we want to compare in the same way and making a grid of depth values within the area of the volcano for each year. Then we simply subtract one grid from the other to get the differences in depth between the two surveys at every grid point across the area. Where there has been no change (typically most of the area), the depth differences are near zero or very small (there is always some level of noise in these data and comparisons). Wherever the depth differences are larger than a certain threshold (something like 5-10 meters or or 16-32 feet) then they could be real signs of activity. The larger the differences are and the more they look like lava flows, the more believable they are.
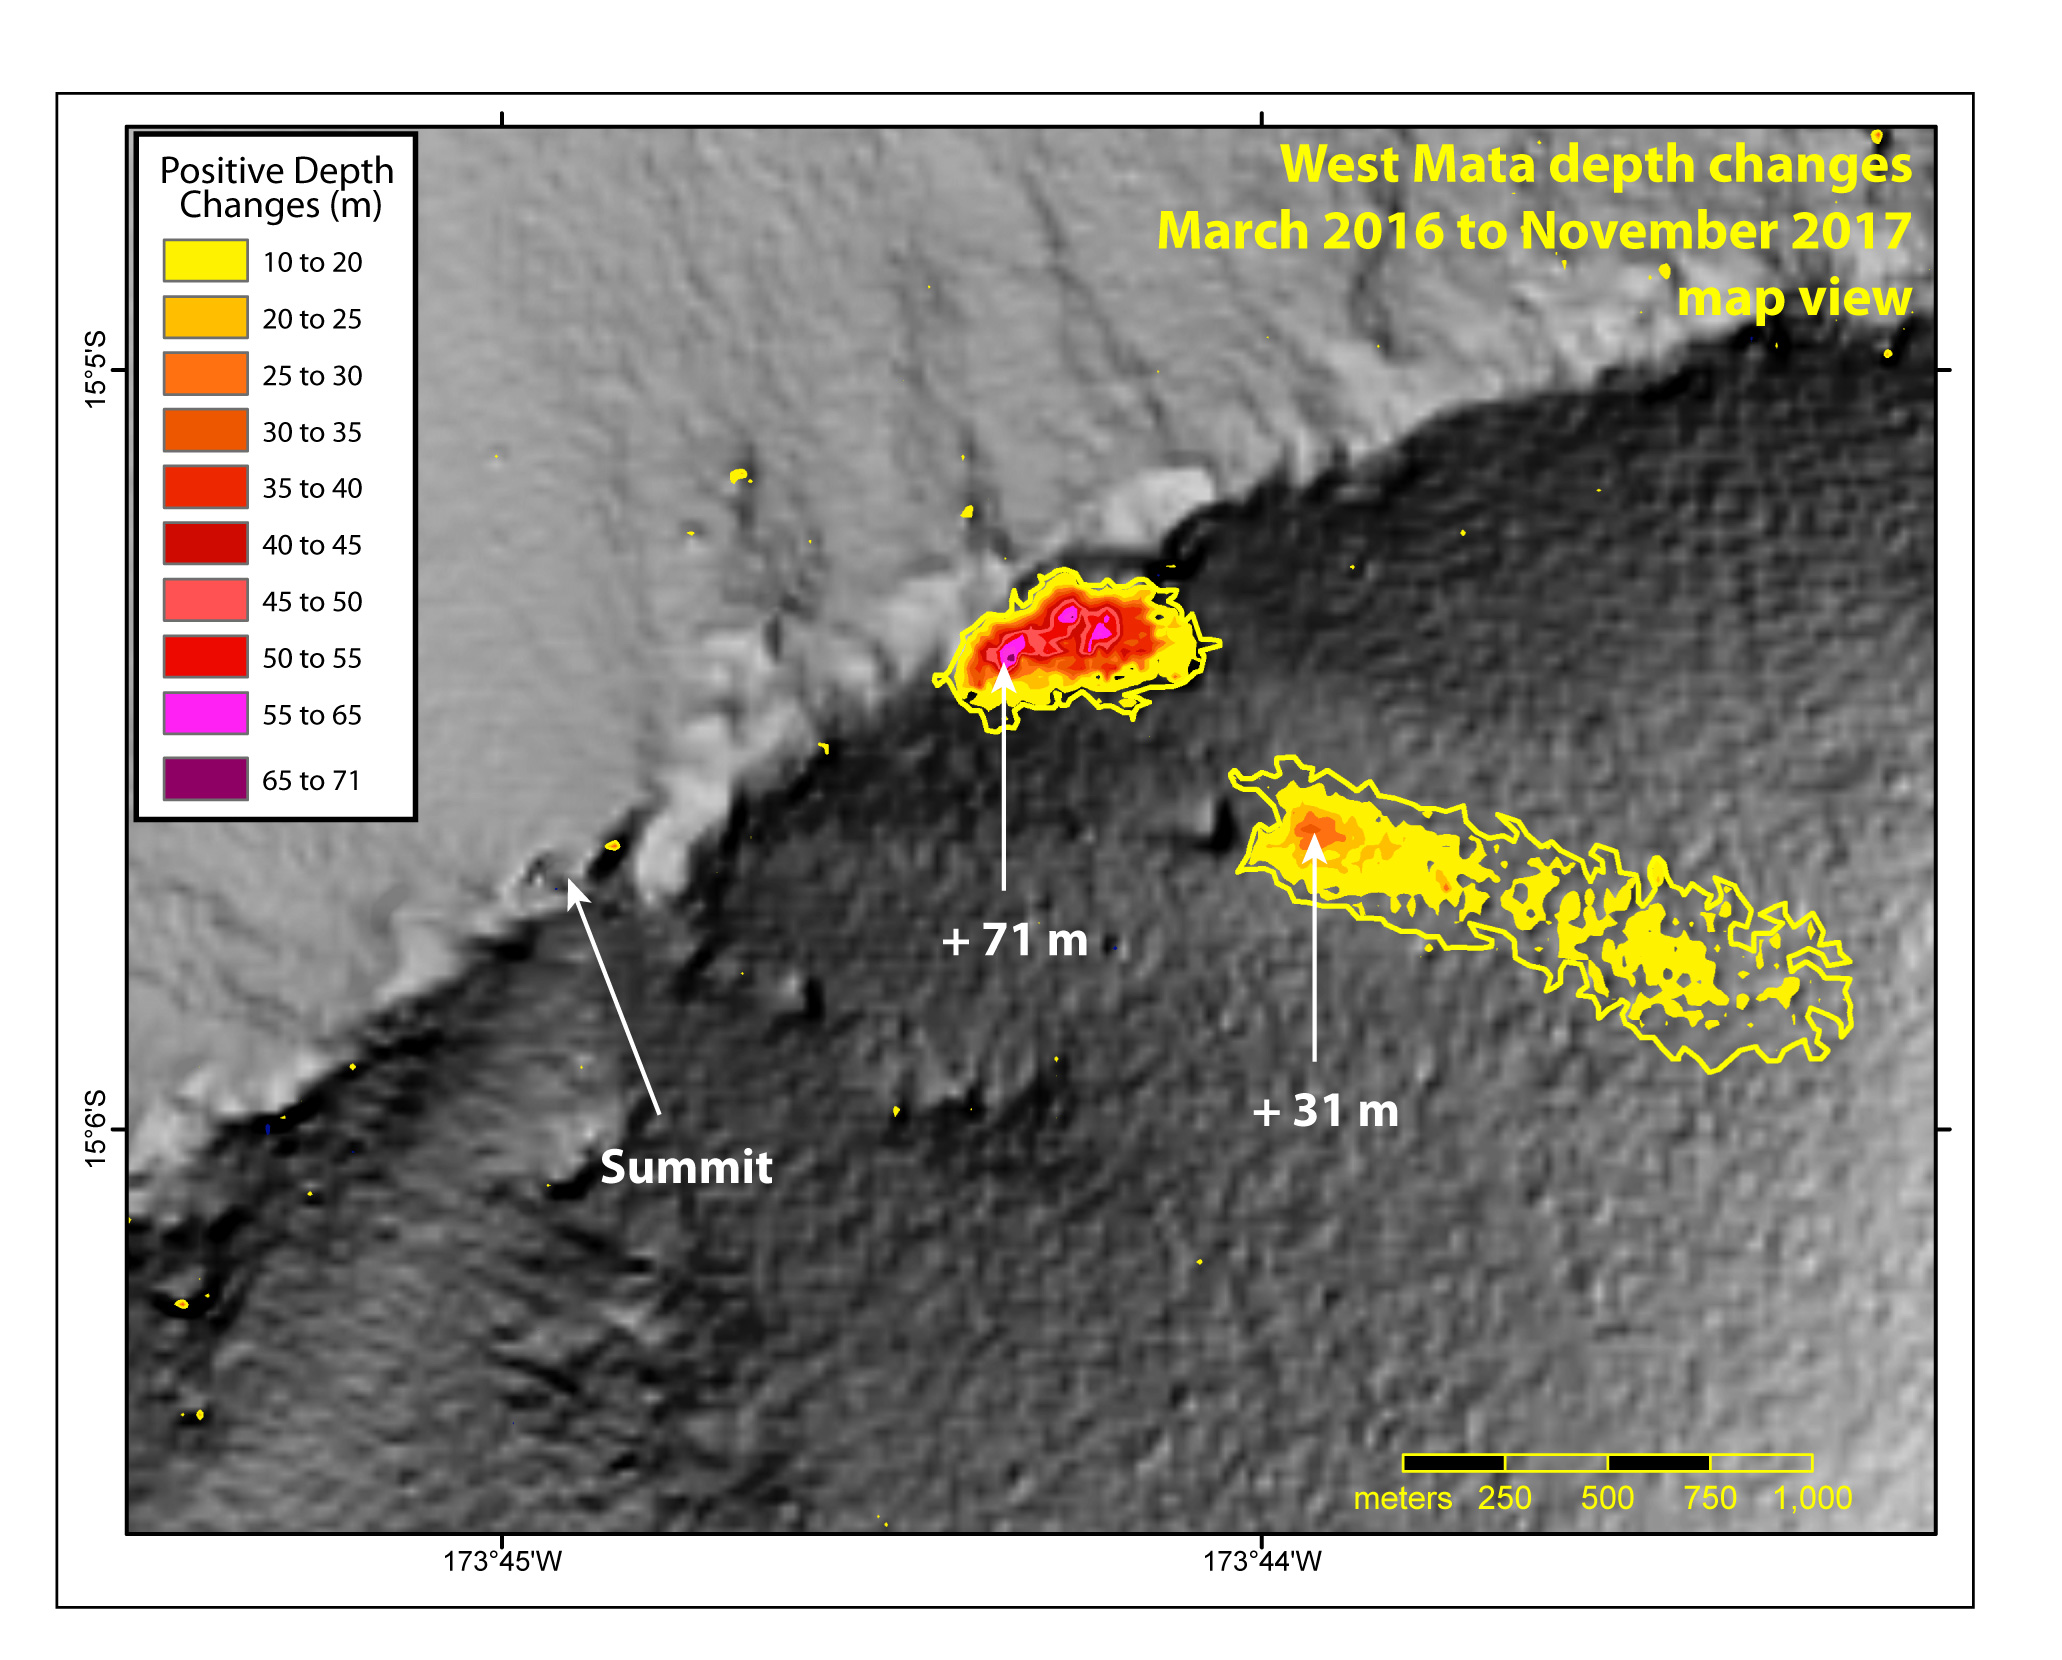
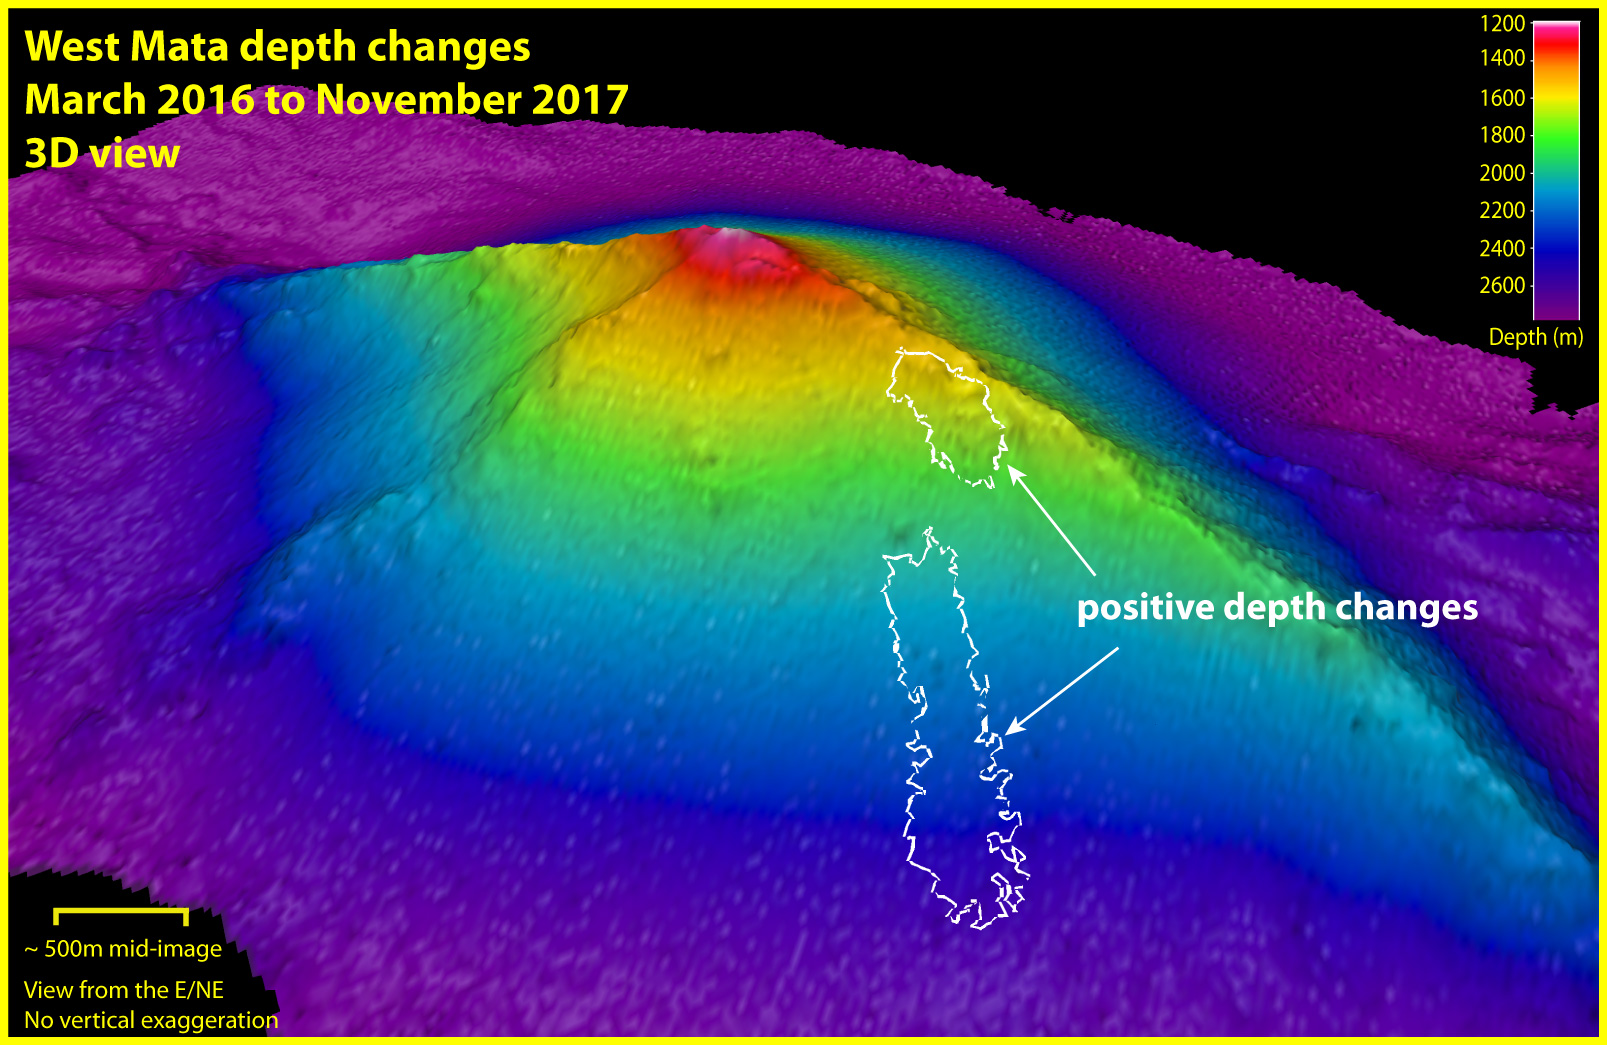
Immediately after we collected the new bathymetric survey over West Mata, we gridded it and made a comparison to the last survey in March 2016. To our delight, two areas with large depth changes jumped out of the comparison. One area is located east of the summit on the NE rift zone and clearly looks like a mound of lava added to the volcano that is up to 70 meters (230 feet) thick. The second area is midway down the SE flank, off the rift zone, and looks more like a landslide deposit, but if so it is somewhat enigmatic because it does not have a clear source area. Alternatively, it could be a fragmental deposit from a more explosive eruption, but that would be unusual in this location. So it poses a bit of mystery for us to try to figure out.
From this we have some exciting new information: West Mata has continued its frequent activity in the last one-and-a-half years, and we have two new eruption sites to explore with AUV Sentry and ROV SuBastian. Our next operation will be to conduct a CTD tow over one of these recent eruption sites to see if it is still venting warm water (or even still erupting?), and this same tow will extend over the summit of the volcano where previous eruptive vents have been located. This will give us an idea of how hydrothermally active West Mata is at the moment and how much venting is getting up into the water column over the volcano. In the meantime, it is great to have an exciting discovery right out of the gate!