One of the main missions for the Sentry Autonomous Underwater Vehicle (AUV) on the first leg of this expedition has been to collect high-resolution bathymetry of the areas where we want to make dives with Remotely Operated Vehicle SuBastian on the upcoming second leg.
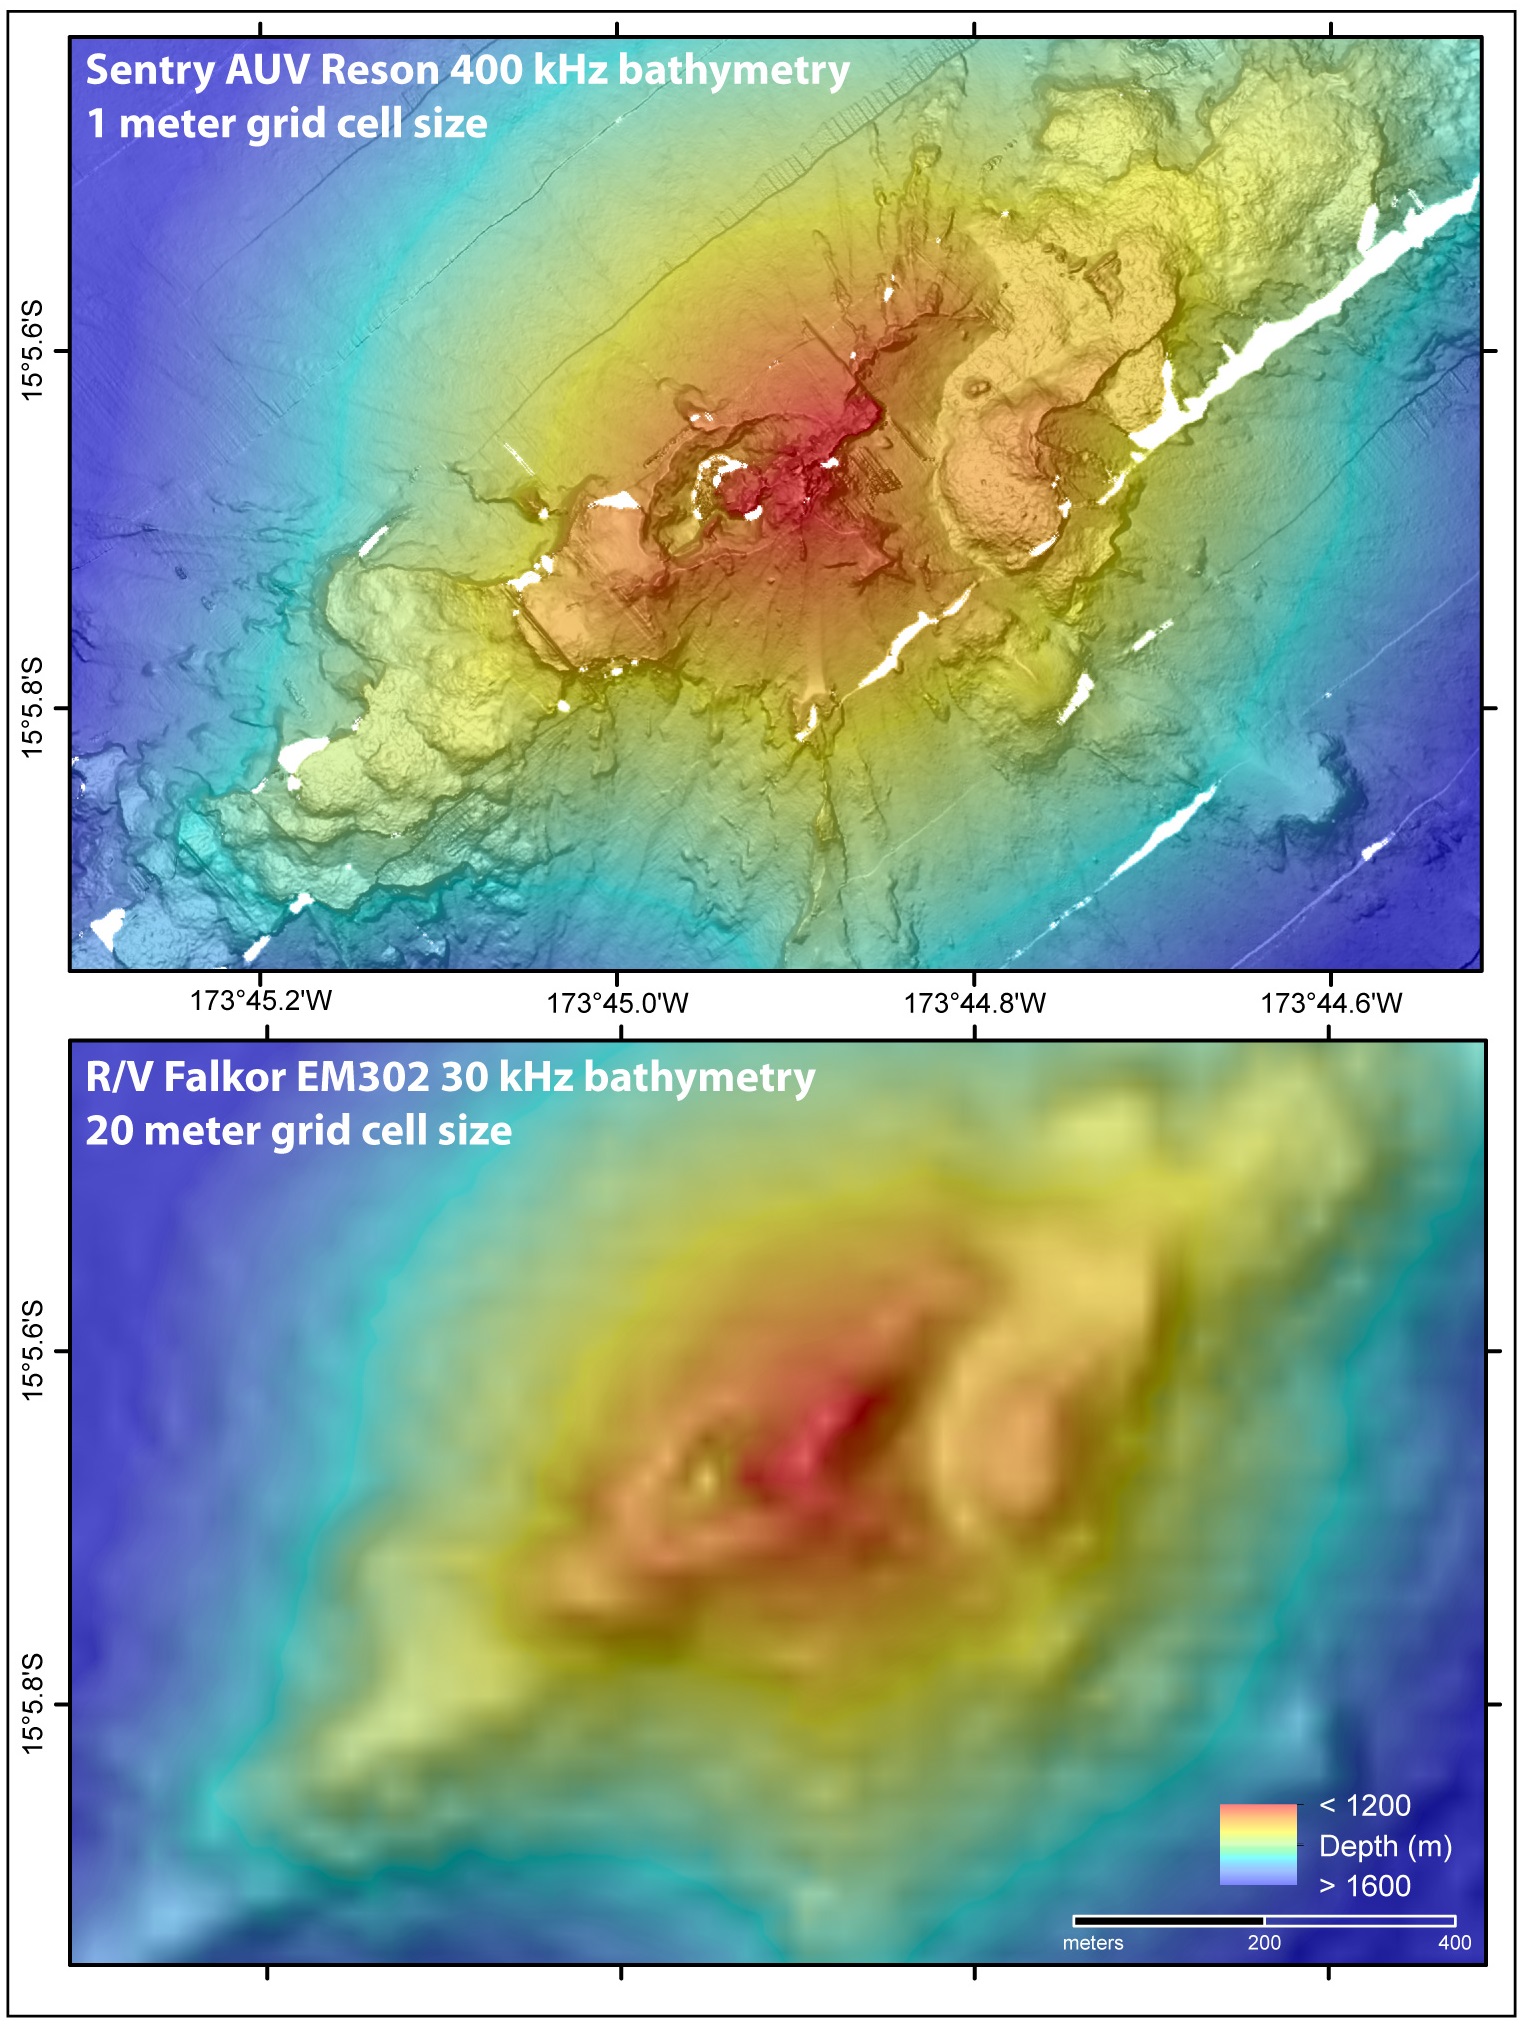
The sonar on Sentry is similar to the one on Falkor, but because Falkor is floating on the surface of the ocean (almost a mile above the seafloor here), the ship’s equipment can make maps of the seafloor with a resolution (or pixel size) of only about 25 meters (or ~80 feet). That is great for seeing big features like entire volcanoes, mapping large areas efficiently, and getting an overview of the terrain, but not enough to see the details of smaller features like volcanic flows and vents. In contrast, AUV Sentry “flies” much closer to the seafloor – only ~70 meters (~230 feet) above the bottom while it is surveying with the sonar. This allows the AUV to make maps of the seafloor with a pixel size of only 1 meter – more than 20 times the resolution of the ship-based maps, but of course over much smaller areas. The finer detail in the Sentry bathymetric maps allows us to see much smaller features like eruptive vents, volcanic craters, lava flows of different ages and textures, faults, fissures, and landslides, and if we are lucky, even hydrothermal vents.
What are they for?
These high-resolution maps from Sentry are valuable to us in several ways. First, they help us interpret the geology of the seafloor from the texture and shape of the features we can see. For example, we can clearly differentiate between areas where there are rough outcrops of rock exposed vs. smooth sediment covering the bottom, where lava flows erupted and where they flowed downhill, as well as where the volcanoes have been dissected by landslides or faulting. Secondly, being able to see all these structures helps us plan our ROV dives on the next leg so that we can identify specific areas to explore and target sampling in precise areas. In addition, the high-resolution bathymetry helps us put the visual observations we make with the ROV into the context of features over a larger area. In the pitch black depths, the lights from the ROV only extend for ~15 meters (up to 50 feet), kind of like driving a car with the headlights on at night. But to make sense of what we see, it helps to know what else is out there just beyond the reach of the lights.
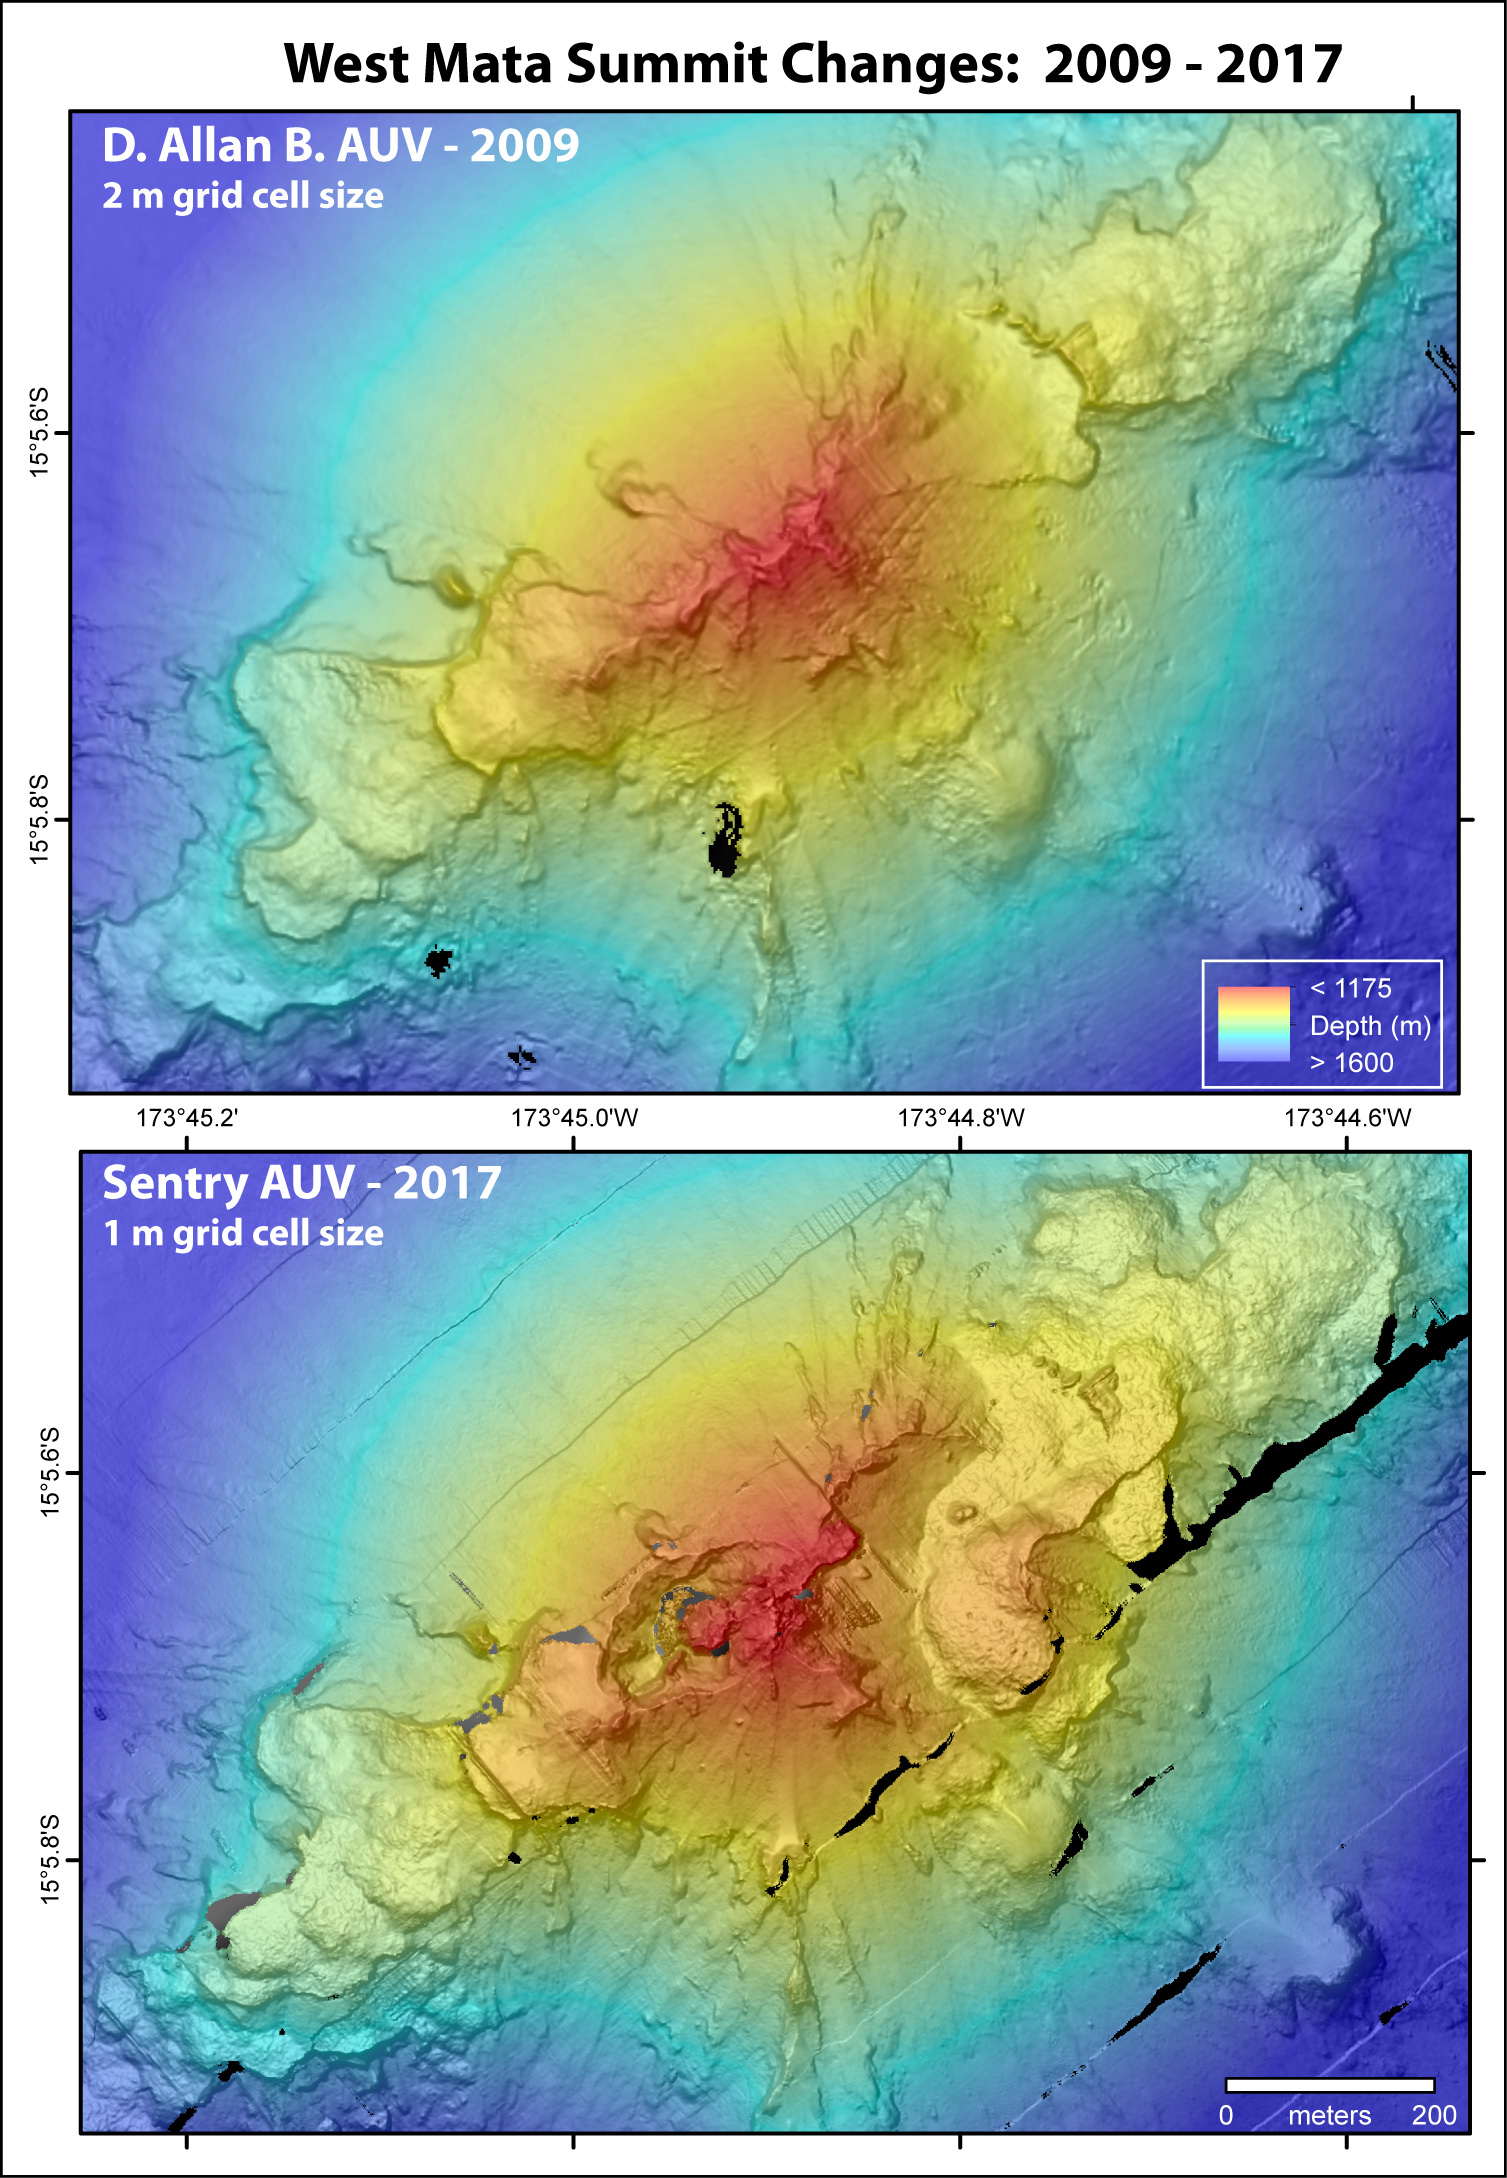
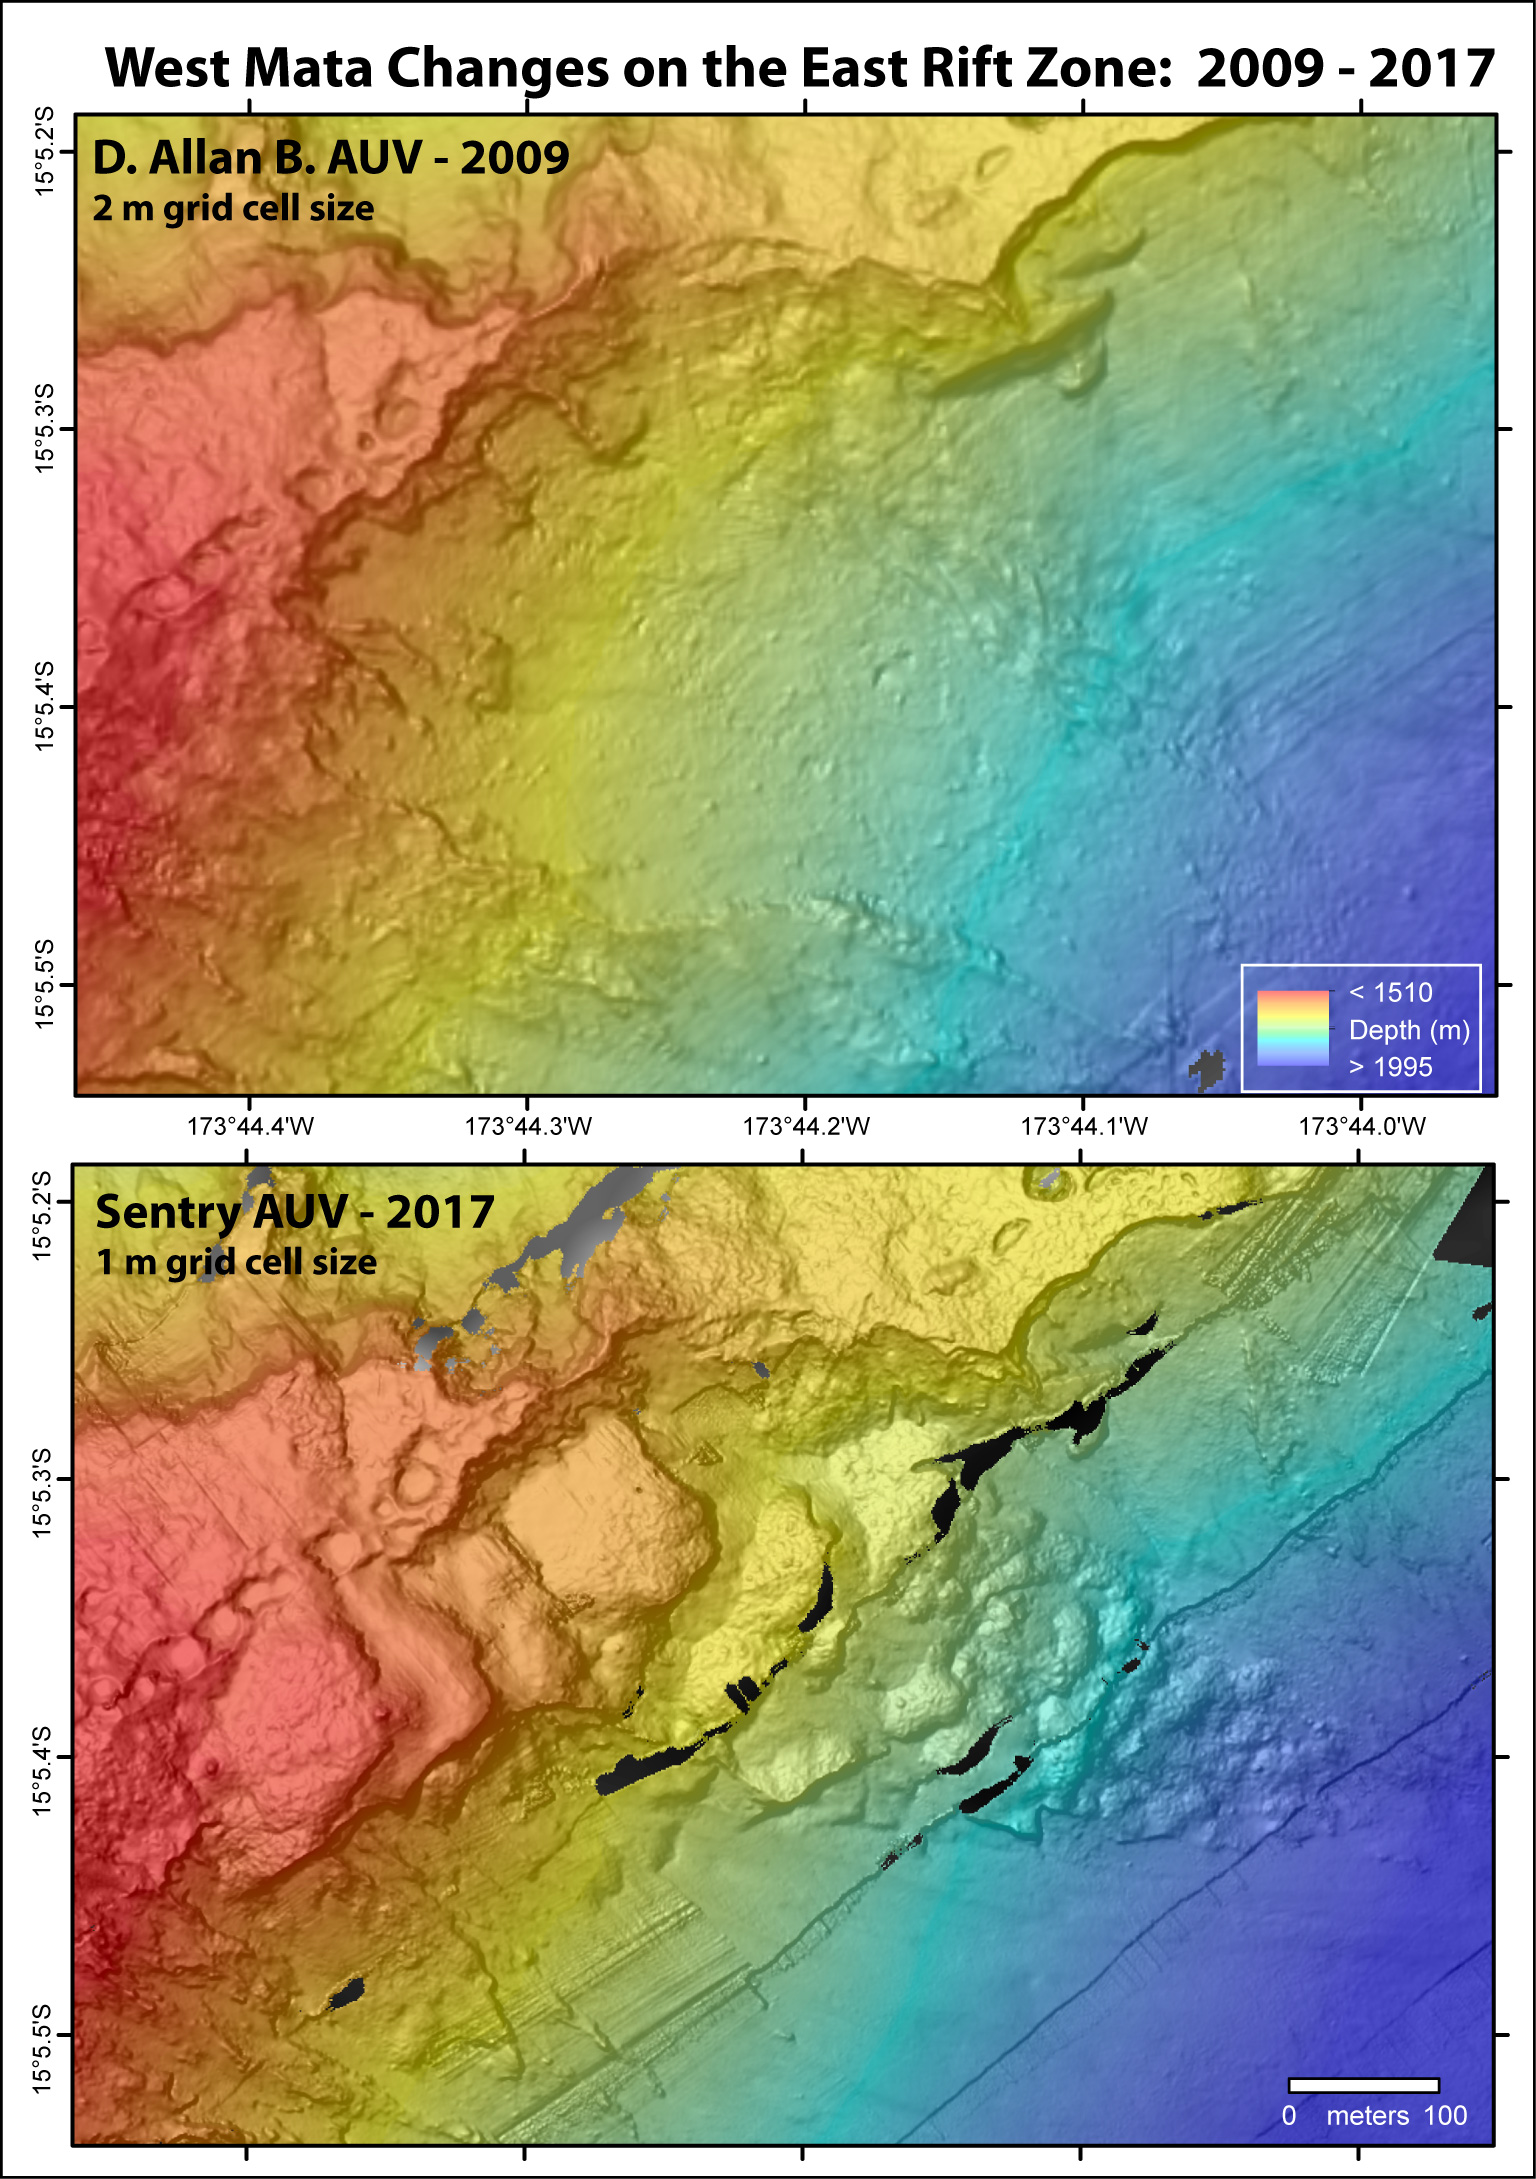
Finally, we can compare these detailed maps created by Sentry this year with similar high-resolution data collected by the MBARI mapping AUV in 2009, the last time West Mata was observed actively erupting at the summit. Comparing these “Before-and-After” maps clearly shows the dramatic changes that have occurred on the seafloor due to individual eruptions at West Mata over the last 8 years. For example, at the summit of West Mata the 2017 survey shows a crater that formed since 2009 that is 200 meters (650 feet) wide and up to 50 meters (160 feet) deep. We know that formed between 2010-2012, but it looks like it has widened since then.
More recent changes include the eruption site that changed the look of West Mata’s east rift zone between March 2016 and now. There, a sequence of lava flows that look like a tilted stack of pancakes or perhaps roof shingles have formed along upper southern slope of the knife-edge ridge that makes up West Mata’s NE Rift Zone. Those terraced lava flows give way to hummocky piles of pillow lavas that have flowed downslope to the south. Being able to see the changes from an individual eruption like this one makes it clearer how the rift zone has constructed incrementally, which each eruption adding flows along the rift axis, but also shedding lava and debris down the adjacent slopes.
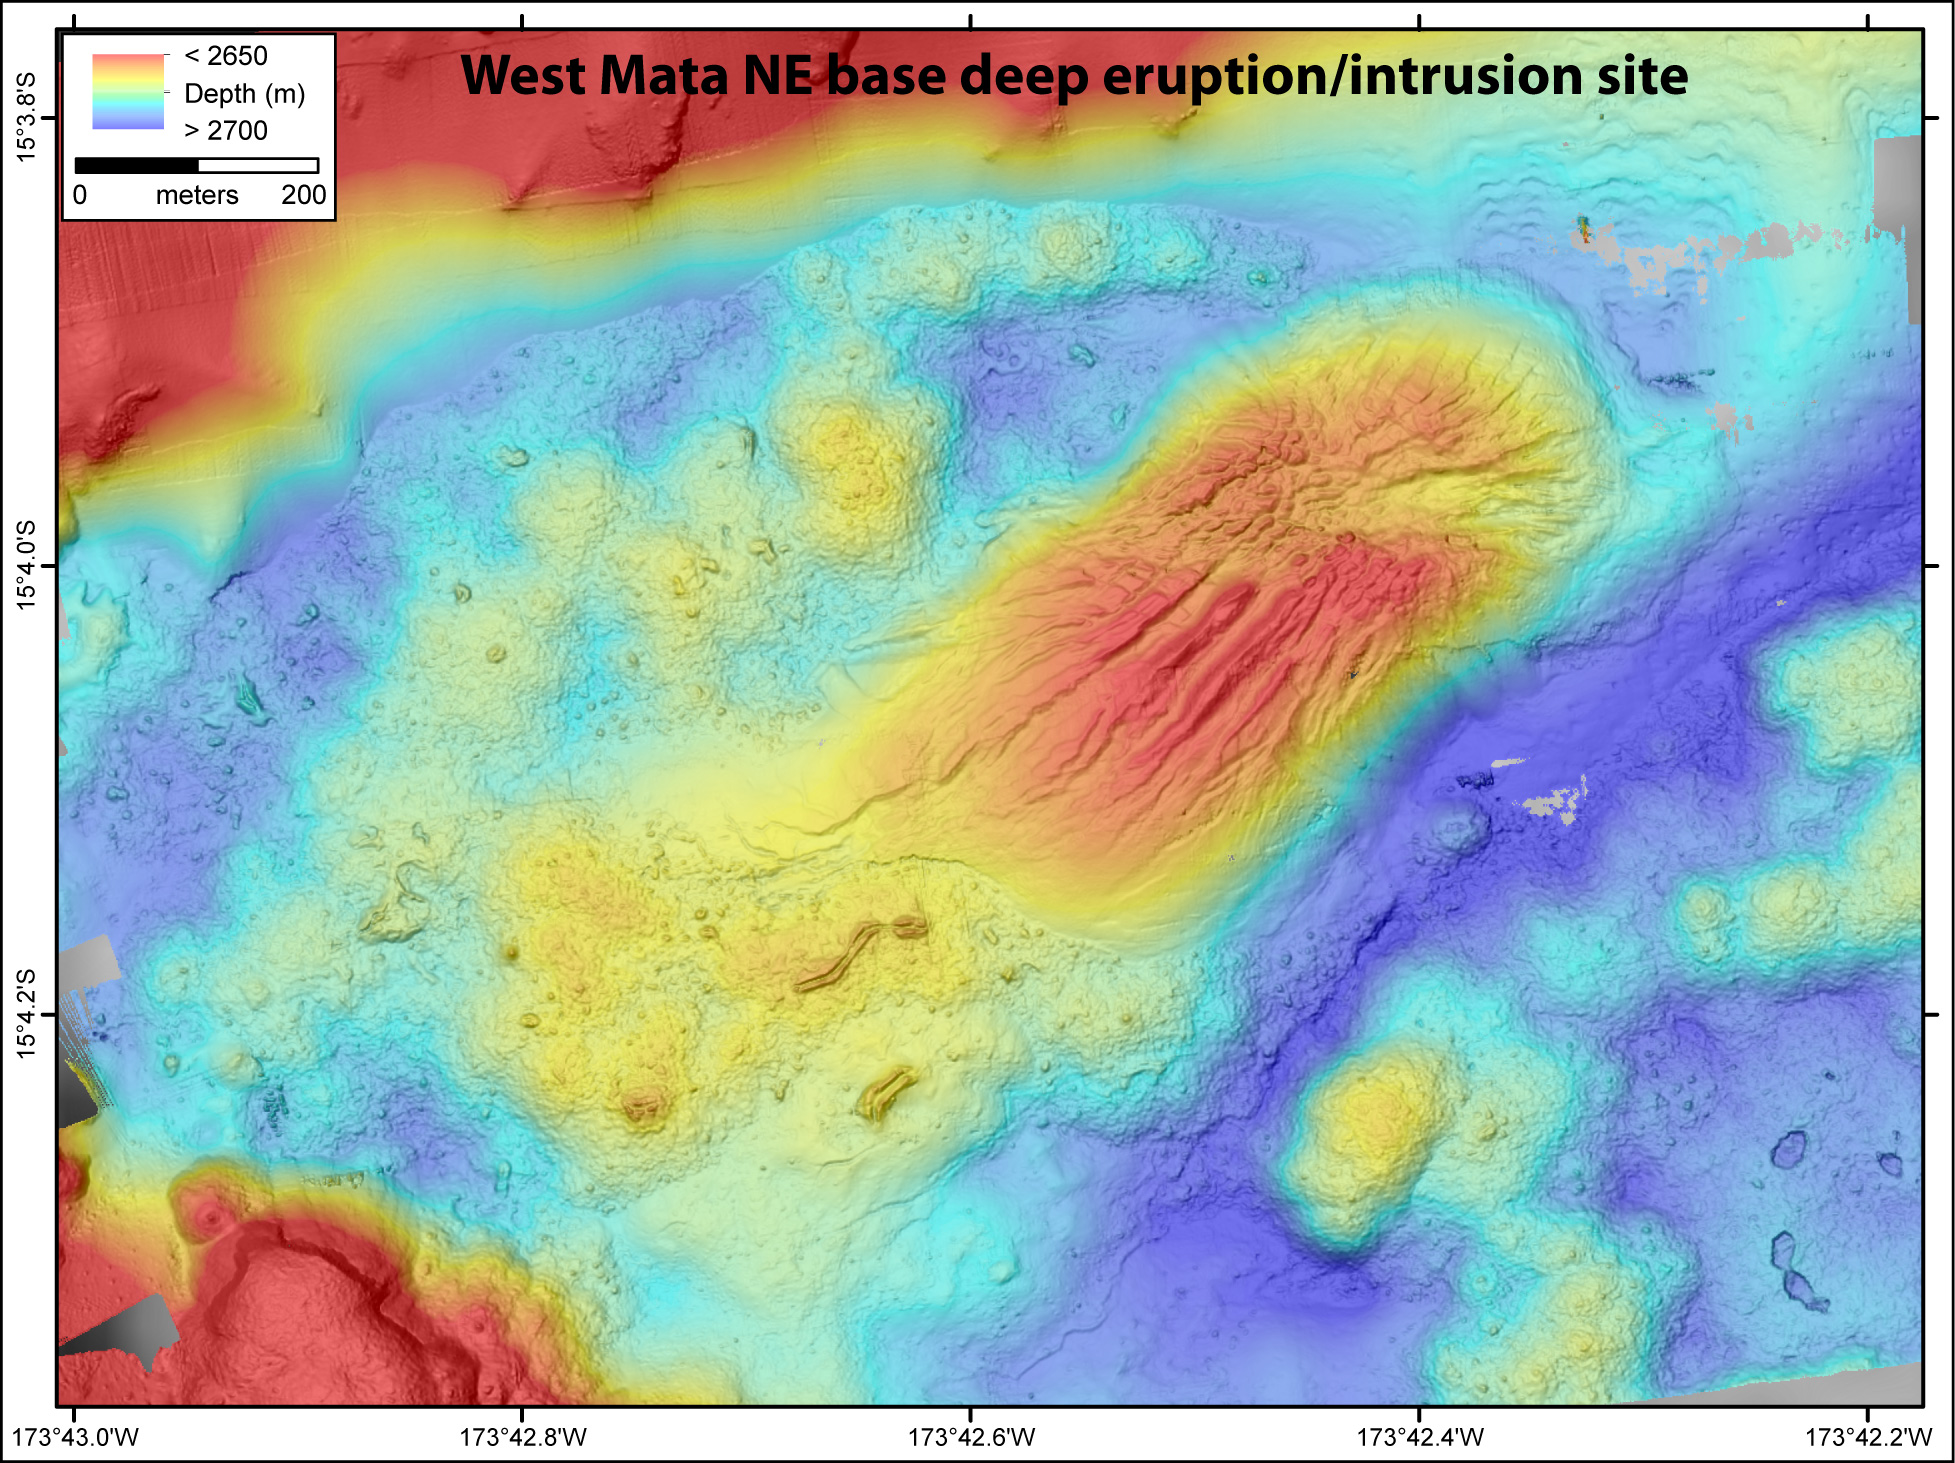
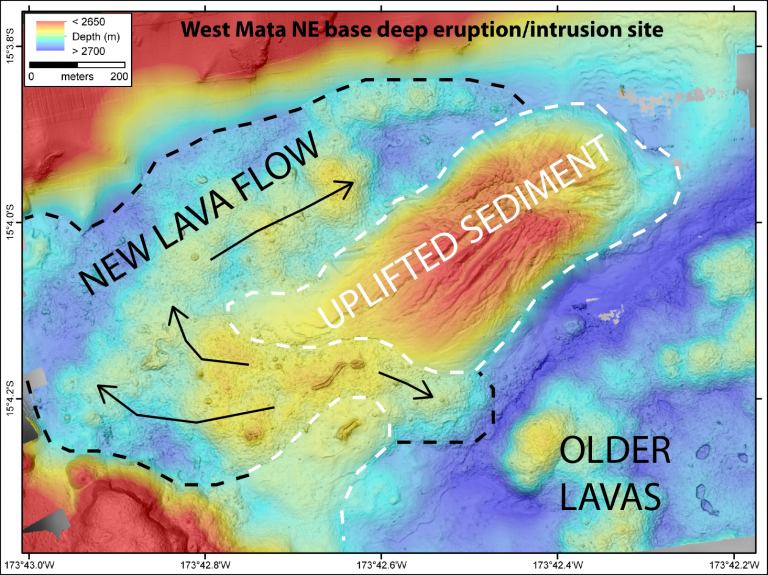
Perhaps the most unusual and unexpected discovery from the Sentry mapping is a feature we informally call “the muffin,” because it looks a little like a loaf of bread or a muffin that has risen in the oven and developed cracks in its upper surface. It is located at the NE base of West Mata, just beyond of the very eastern end of the east rift zone. We knew this was an area of depth change (up to 65 meters or 210 feet) between 2011 and 2016 from ship-based sonar surveys, but we couldn’t tell exactly what had caused it. Was it a lava flow? Had there been a landslide there? From the Sentry map, we have put together a story about what we think happened here: We think magma from West Mata rose from below into this sedimented basin, and as it rose through the pile of sediments (and before it reached the surface), it spread out laterally into a pancake-like body and thickened. As this occurred, the magma pushed up the sediments above it, which domed and spread laterally, cracking the upper surface. After this doming and cracking the magma kept rising and finally made it to the surface, erupting on the edges of the domed-up sediments (“the muffin”), and spreading out around it as a lava flow. This was very surprising to find and we are very excited to have a look at this curious feature on the seafloor with the SuBastian ROV on the next leg!