There are a number of ways to present or visualize oceanographic data. When an instrument like the CTD is lowered to the bottom, it provides an instantaneous picture of all the water properties at the drop site. Similarly, when we lower the turbulence probe (TurboMAP) it provides a picture of ocean turbulence properties over depth – in the case of the TurboMAP every 1mm vertically. Such high spatial resolution is necessary to resolve the complex eddy motions that characterize all turbulent motions in the ocean or the atmosphere.
Pictures in time
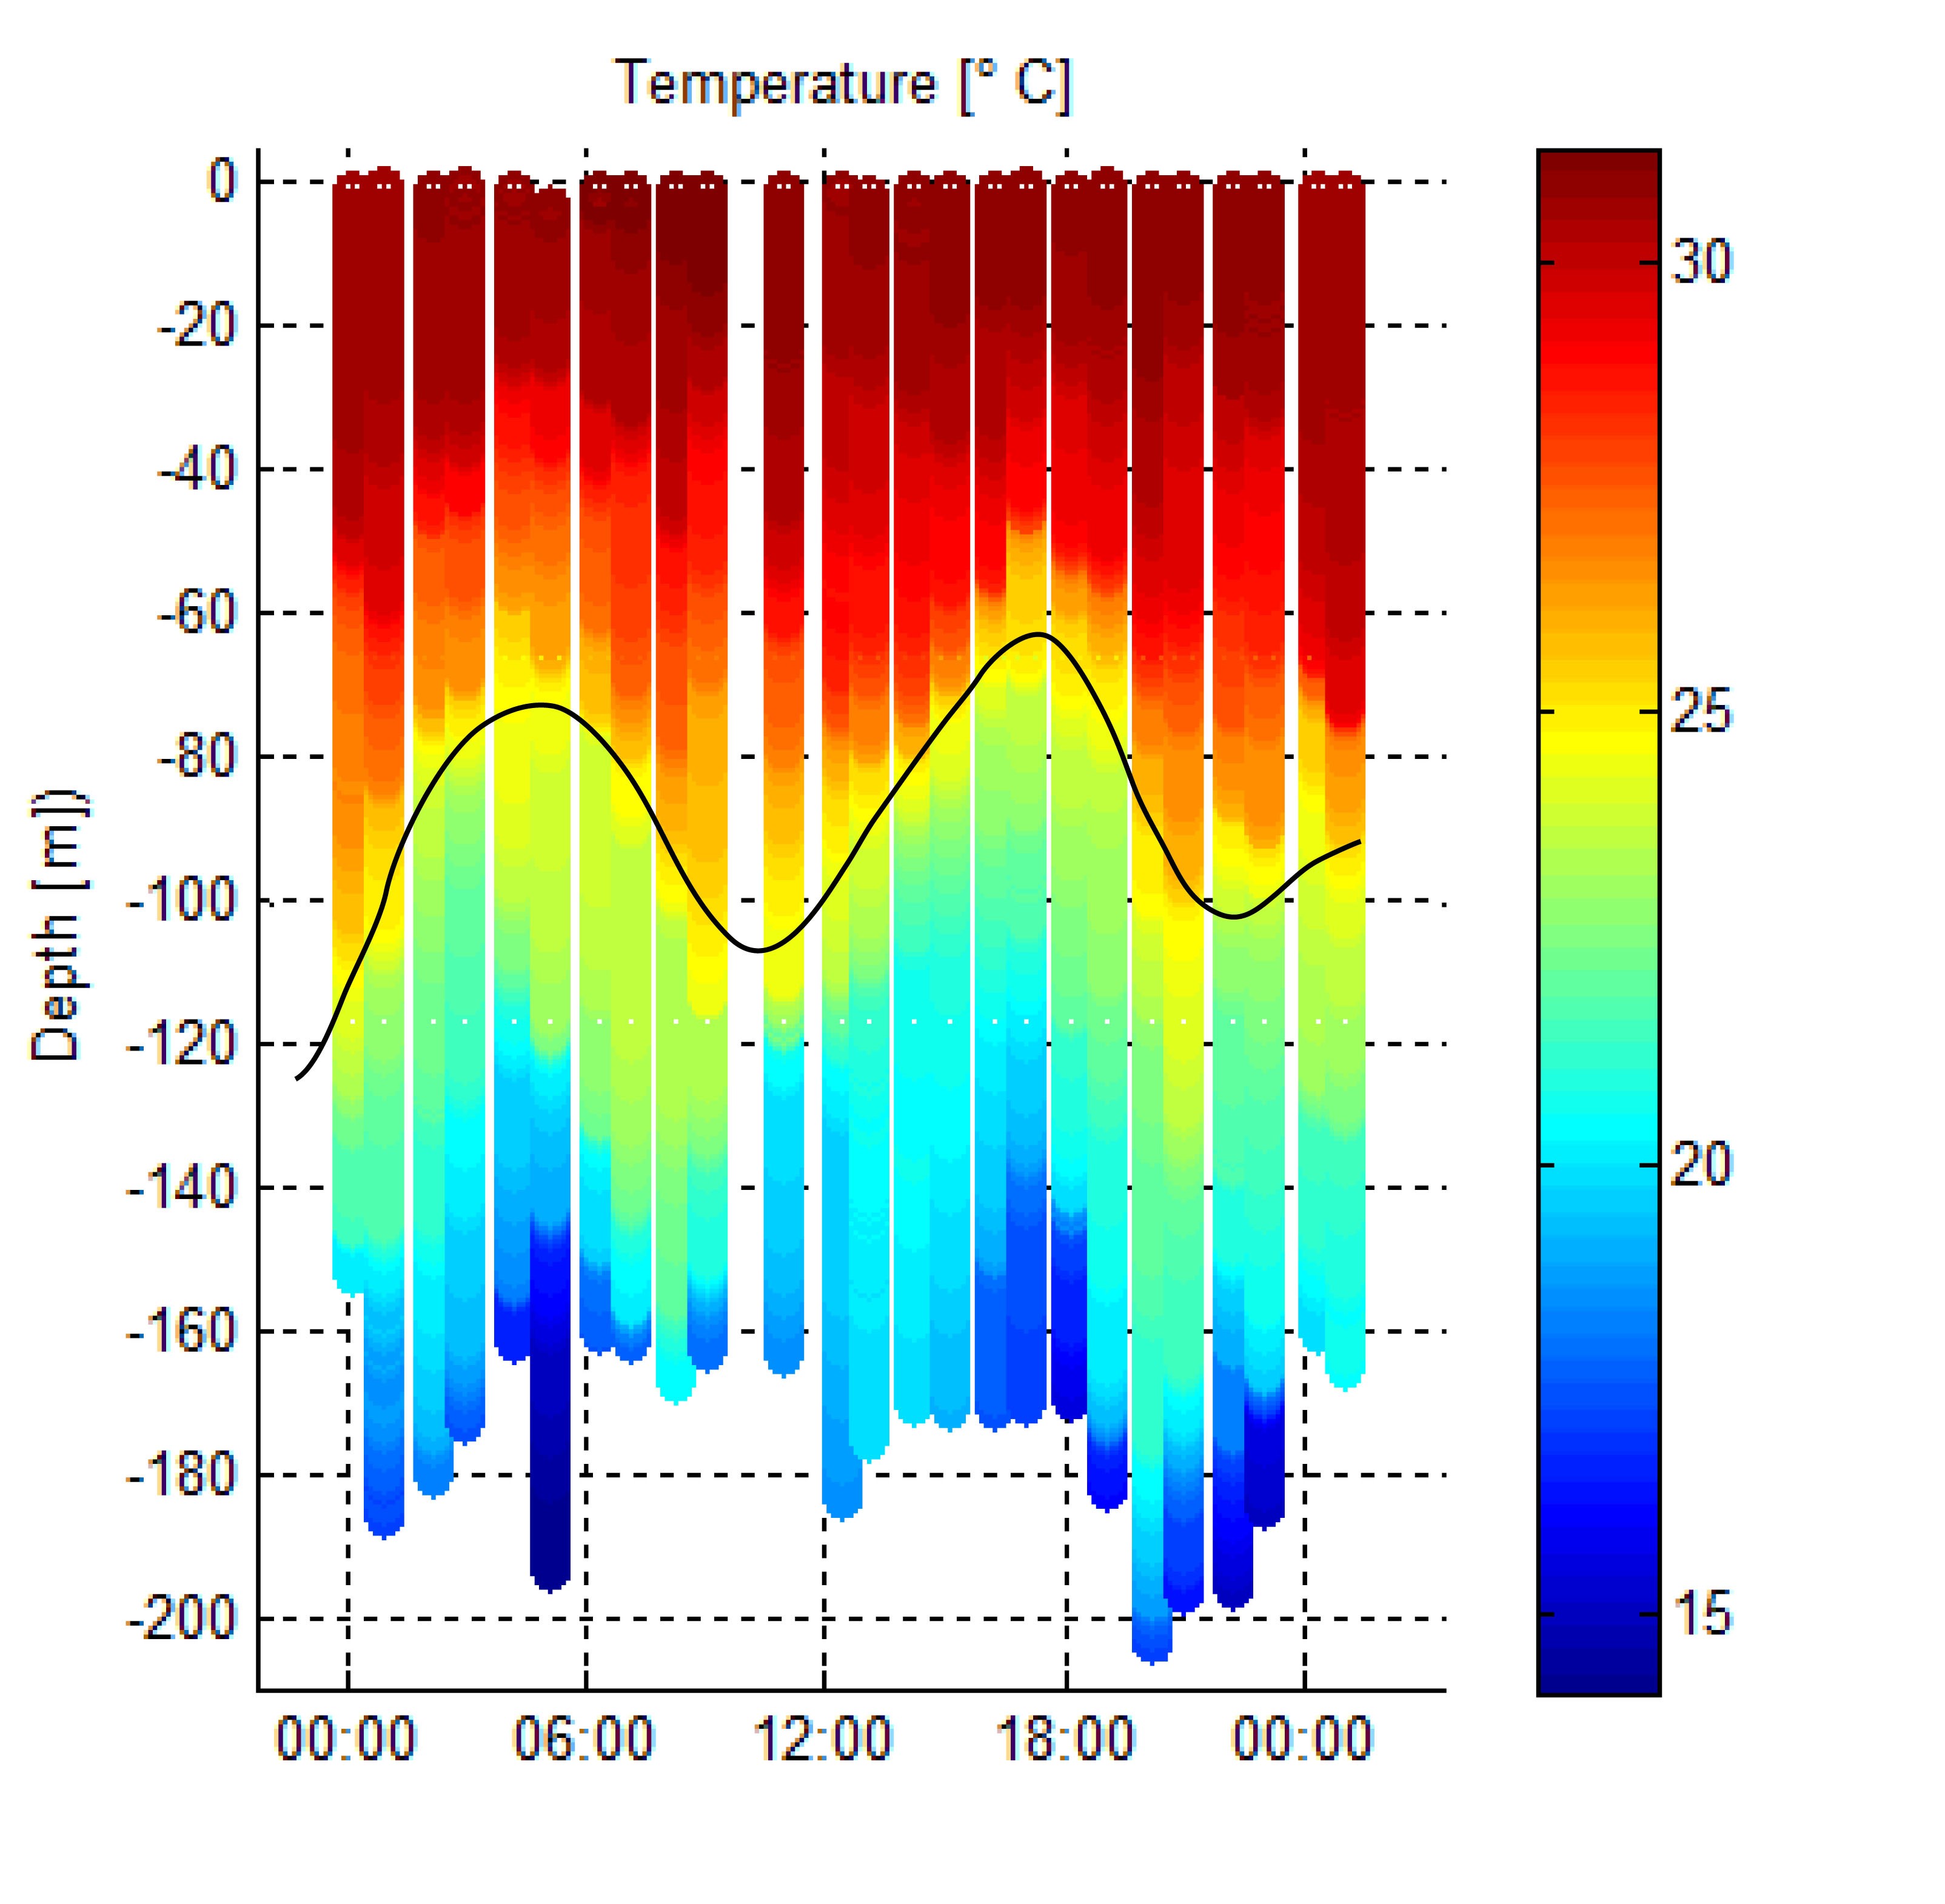
During this cruise, the science team will visualize ocean data in two fundamental ways: using a picture in time at one location, or a picture in space at one instant. A nice way to interpret these data, which are tidally driven, is to imagine a curtain. If you consider the “wavy” nature of a curtain, the data can often look similar, illustrating an oscillating pattern of the water column fluctuating with respect to the tidal cycle. If the science team sits on one site, and does repeated profiles at hourly intervals, then the team can construct a picture or “curtain” in time. An example is provided in the figure to the right, which shows fluctuating jumps in the vertical temperature profiles as indicated by the black line. These jumps or strong gradients are called ‘thermoclines’ and our measurements show the position of the thermocline as it moves between 60m and 120m water depth in just six hours – indicating an internal wave.
Pictures in space
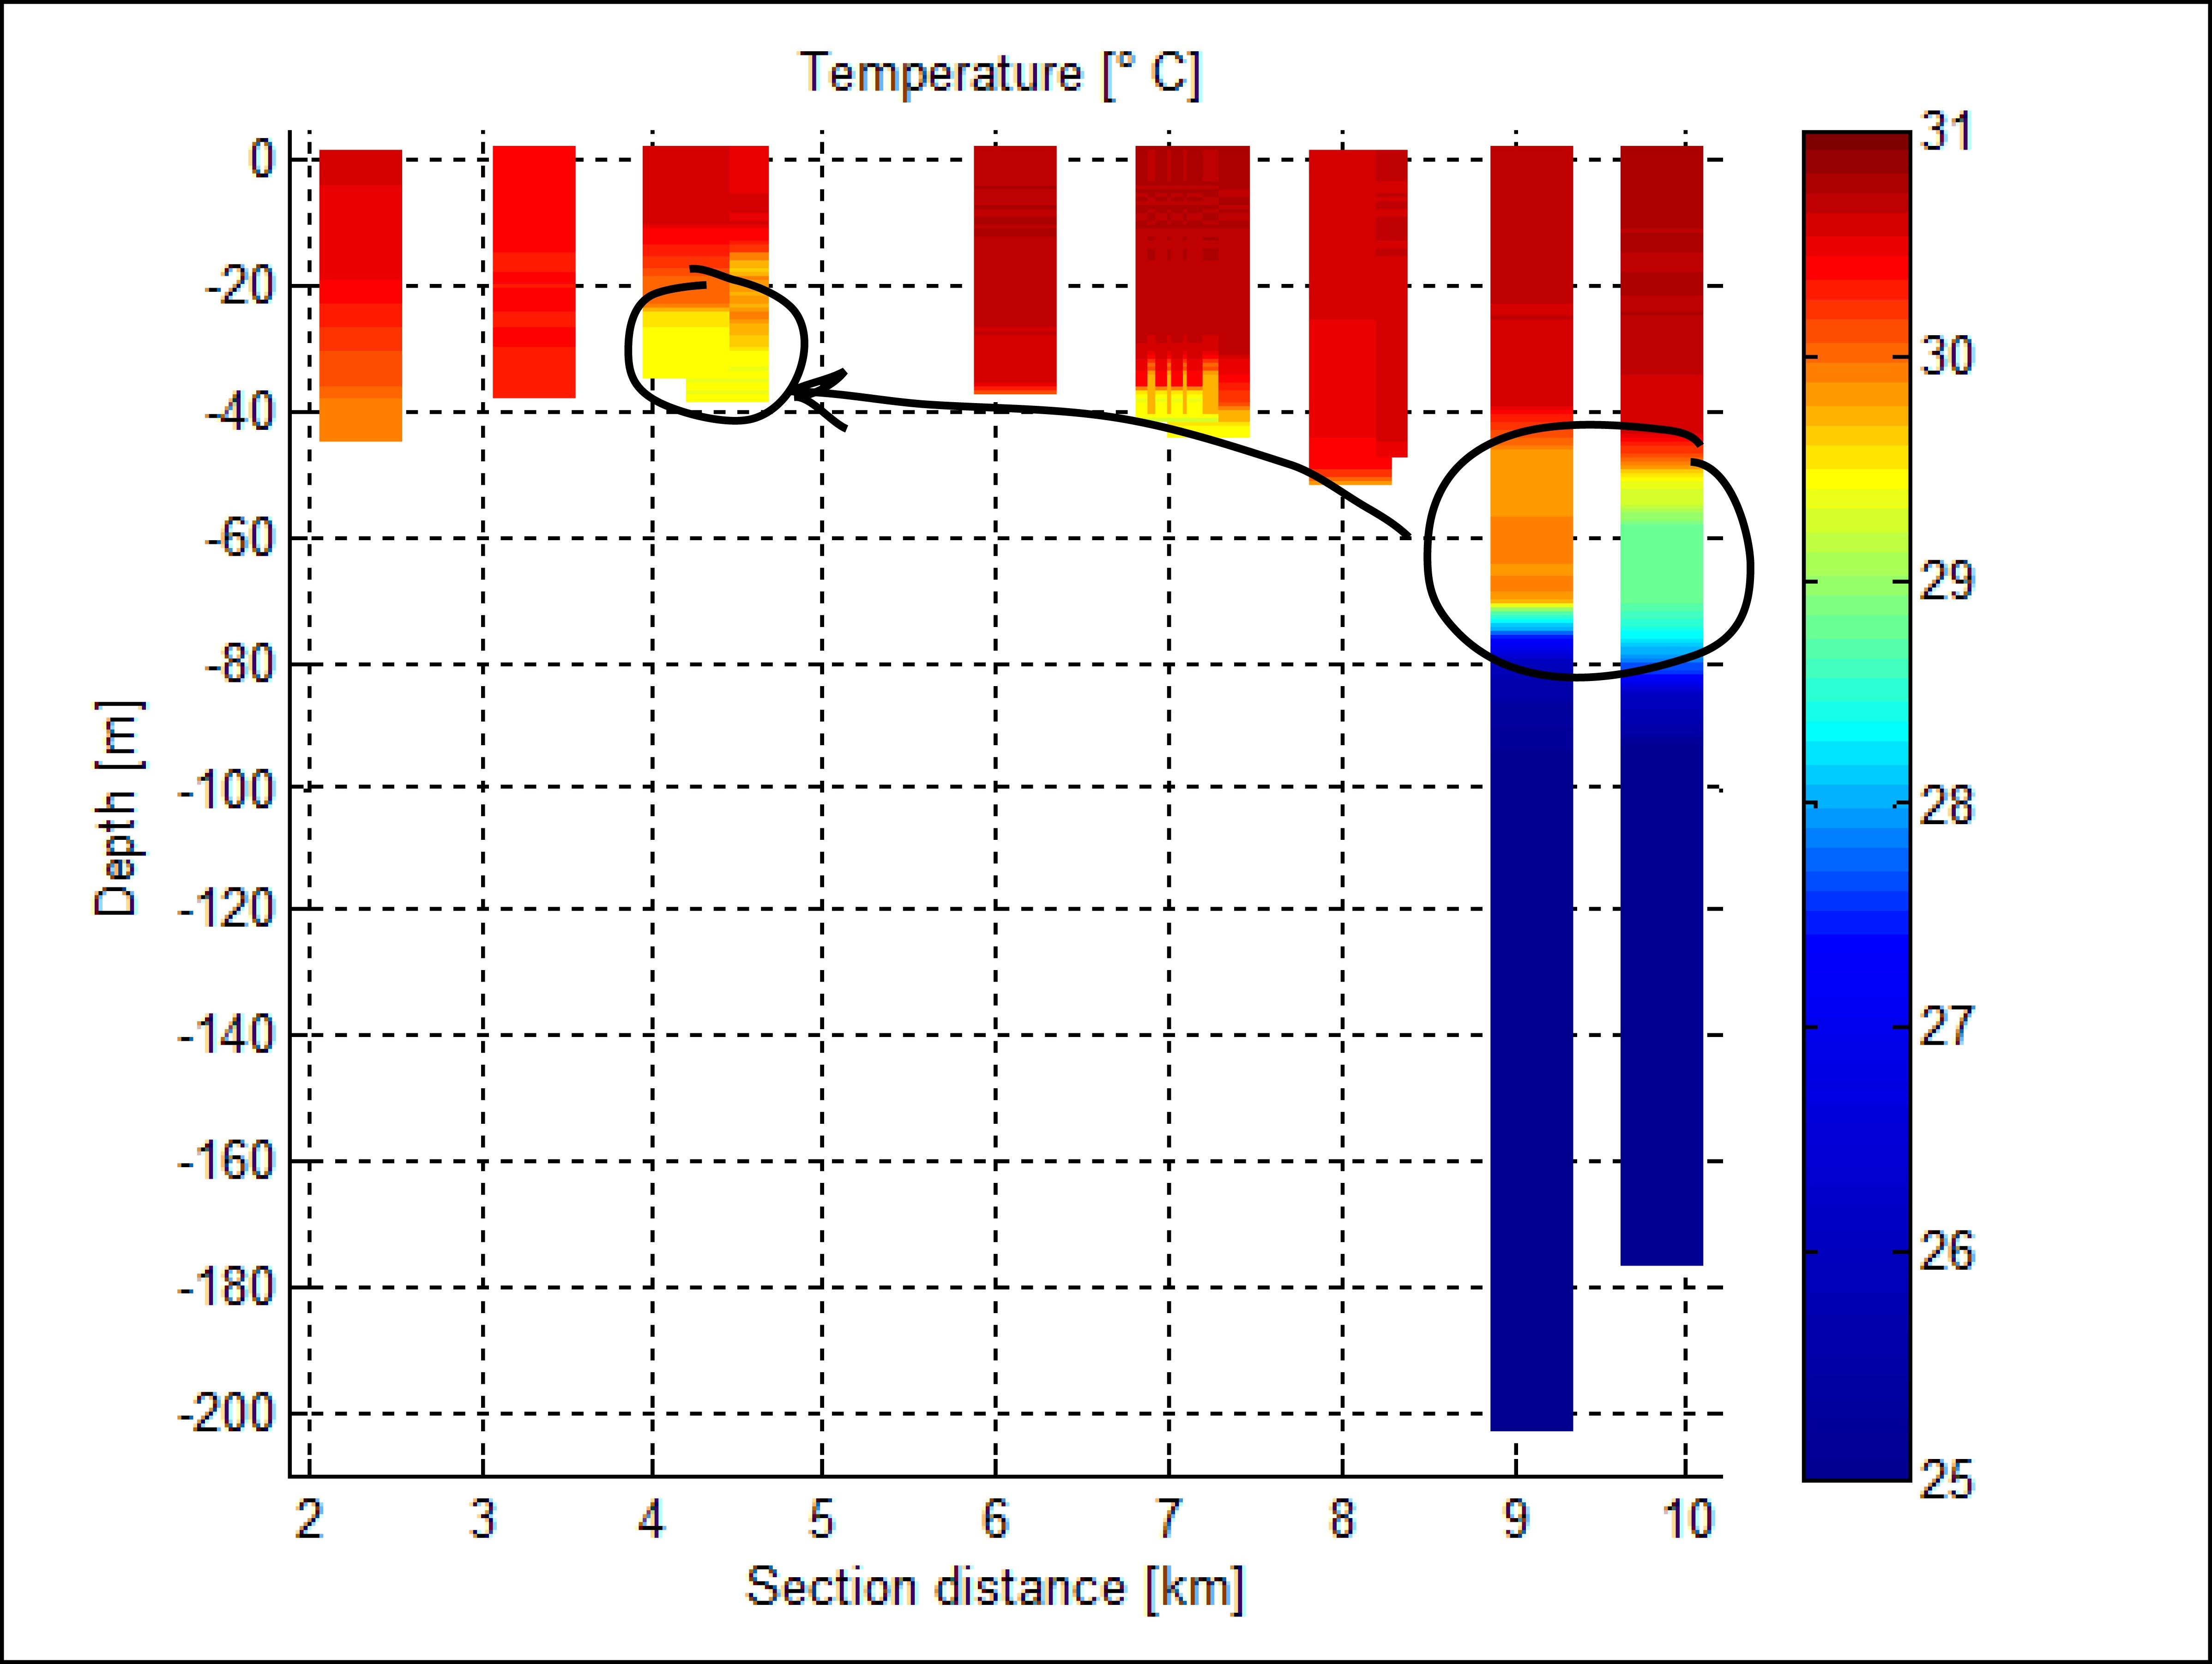
Alternatively, the team can visualize the ocean with a “curtain” in space. The data is obtained by having the ship steam along a certain path or transect, stopping periodically to lower instruments like the TurboMAP to the bottom, and continuing along to the next site, hence building up a spatial picture. That is, from station to station the science team is attempting to illustrate the properties of the water column during the same stage of the tidal cycle; essentially following the tide. An example is shown in the Figure to the right, where a dozen individual horizontal drops are made with the TurboMAP over a ship transect of about 10 km starting from the lagoon and going into the open ocean. Notice that the data shows an unusual cold cell of water at the 4 km mark near the ocean bottom between 30-40m. The cold water must originate from deeper offshore water at the 10 km mark in a depth of almost 75m. This is a relatively cold water mass that has been lifted about 30m and transported 10 km horizontally by the tide in just a few hours. The horizontal transport is an example of “tidal pumping” and illustrates how strong the tidal flows are at Scott Reef.
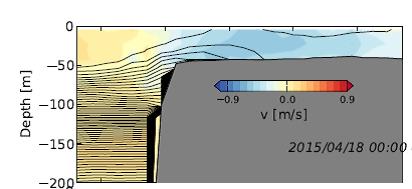
This scenario can be verified by the numerical model shown in the figure below from SUNTANS. It takes some time for the ship to move between each station and to lower/retrieve instruments, so the curtain does not represent a single snapshot in time.
An ocean forecasting first
The strong tidal flows in the region means that the current magnitudes and directions change rapidly – every six hours. This makes it difficult for the science team to choose a transect, so how do we know when to start and stop, and how to interpret the results? The answer lies in a detailed ocean circulation model, running on Falkor’s supercomputer Nebula. This computer allows the team to forecast conditions for any region down to horizontal scales of about 200 m. Having access to a high performance computing system at sea, is a unique feature of Falkor. The scientists use this to decide where, and when, to make measurements. The process is much like weather forecasting on the evening news and is how they try and optimize the measurement process to be as efficient as possible. The team found this method much more effective, as opposed to just lowering instruments over the side and hoping for the best, however, as Einstein says “If we knew what it was we were doing, it would not be called research, would it?”