My name is Kate Malloy. Despite being an undergraduate student from James Cook University studying marine biology, I recently learned to look past all the fish in the sea on a student exchange to Hawaii and began to develop an interest in physical oceanography. I am currently on board the R/V Falkor learning how to study the ocean currents in the northern Tasman Sea (east of Fraser Island on the east coast of Queensland, Australia).
Most people in Australia (and the rest of the world) have heard of the East Australian Current (or the EAC dude! as the turtles like to call it) in the Pixar movie Finding Nemo. The EAC is a southward western boundary current that brings warm nutrient-poor water from the equatorial region into the Coral Sea via the North Vanuatu, North Caledonia, and Southern Caledonia jets. It then flows north and south along the edge of the Great Barrier Reef and the east coast of Australia. It is also worth noting that the EAC flow is not straight and typically displays eddies that form due to instabilities in the current due to interactions with topography and cooler water masses. Eddies often form as currents flow around seamounts (imagine a river’s flow around a rock).
While we know quite a bit about the EAC, less is known about the flow in the northern Tasman Sea offshore from the EAC.
How do we study currents and eddies?
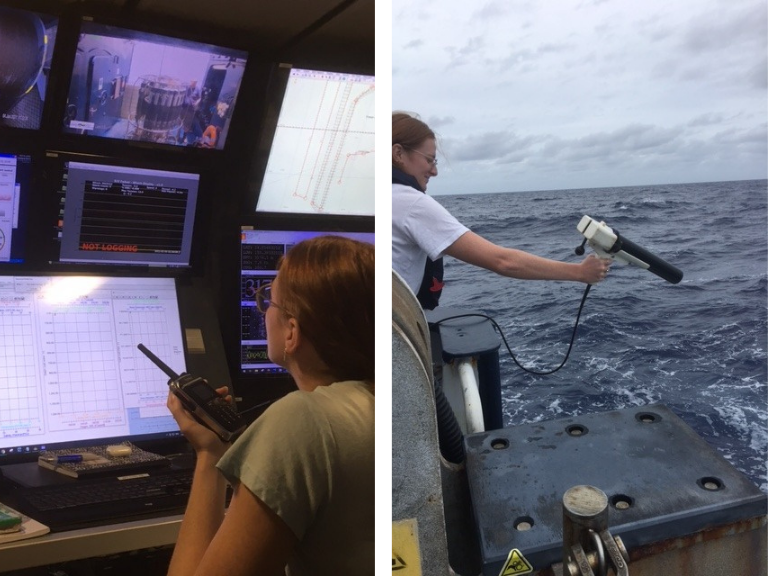
The oceanographic instruments on board the R/V Falkor include an Acoustic Doppler Current Profiler (ADCP). The ADCP is like SONAR: it releases four beams into the ocean that can only reflect to the transducers if phytoplankton are present. The ADCP on board the R/V Falkor measures the speeds and directions of the ocean currents between these four beams down to 800 metres below the sea surface. This allows us to observe eddies and currents in the upper layers of the ocean and how they interact with the seamounts and the complex seafloor of the north Tasman Sea.
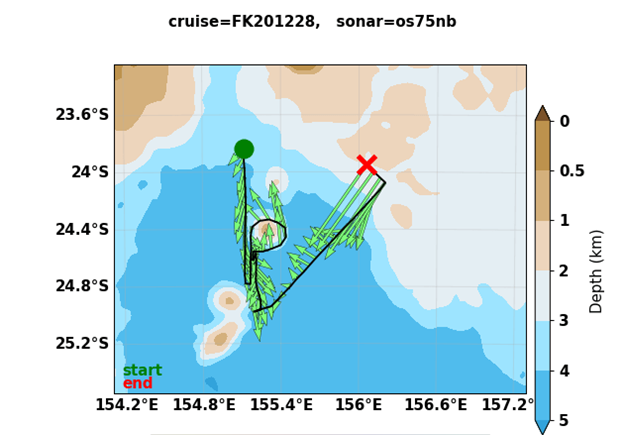
The ADCP data map shows that the currents on the Chesterfield Plateau (the shallower rise to the east) are predominantly flowing to the southwest. The data also indicate that the subsurface currents are strongly influenced by topography and display some interesting flow and eddies around the submarine Recorder (double seamount in the south) and Fraser (middle) seamounts. Therefore to improve our understanding of ocean circulation, we need better maps of the seafloor, which is the primary objective of this R/V Falkor voyage.
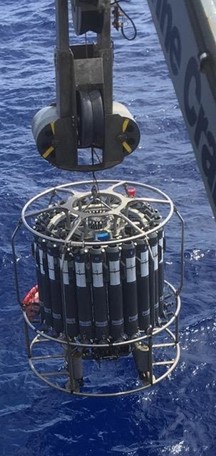
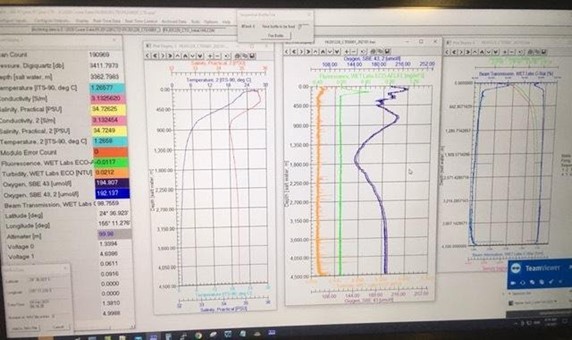
The Falkor also has a CTD – Conductivity, Temperature, Depth profiler, which can be lowered down to the bottom of the ocean. We can calculate salinity, density, and sound velocity from the conductivity, temperature, and depth parameters. The CTD also has sensors to measure oxygen concentrations, fluorescence, and turbidity. We undertook a CTD between the Recorder and Fraser seamounts down to depths of 4500 m. The sensor measurements provide information about the water mass characteristics of the different layers in the ocean, which all have unique properties depending on their sources, mixing, and currents at different depths. We were also able to collect water using the Niskin bottles (the grey tubes on the outside of the CTD rosette).
The water from 4500 m was extremely cold and salty (from an impromptu taste test the scientists carried out). It also had a high oxygen concentration. Thus, despite being in the subtropical ocean, below us are very cold, salty, dense waters originating from the Southern Ocean and Antarctica, highlighting how the oceans connect all the world’s different regions.