The science team onboard Falkor are deploying CTDs during the voyage to determine physical, chemical, and biological properties of the water column. This information is used to calculate accurate water depths for our multibeam echosounder data and also characterizes the water masses in our study region. For example, between Pohnpei and the two atolls, we crossed the boundary between the east-flowing Northern Equatorial Countercurrent and the west-flowing South Equatorial Current. Water masses associated with these two currents differ in their properties.
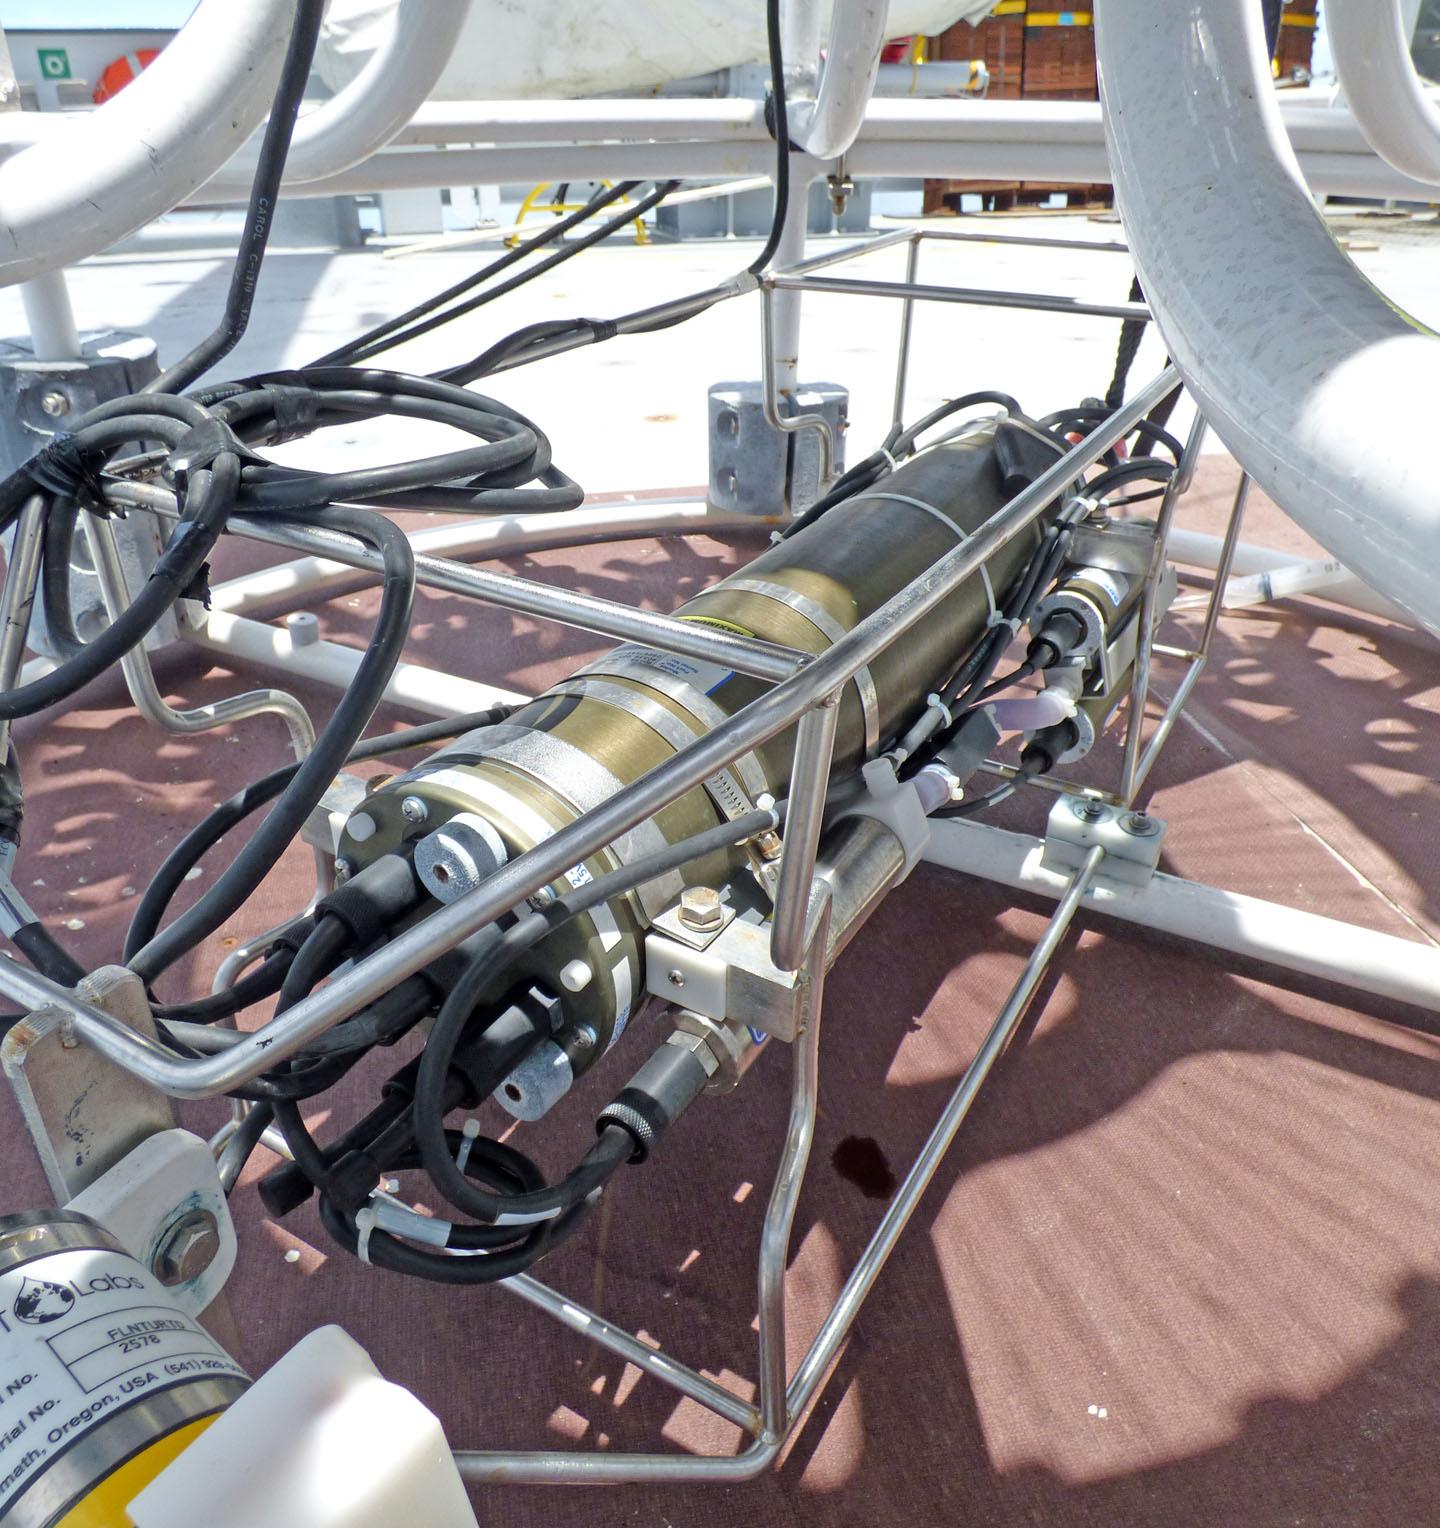
CTD’s can carry a wide range of sensors, allowing for flexible data collection. The CTD on board of Falkor not only measures conductivity, temperature, and depth, but also carries sensors that record oxygen content, fluorescence (a proxy for chlorophyll or productivity) and turbidity. Dual conductivity and temperature sensors are carried to allow for data redundancy.
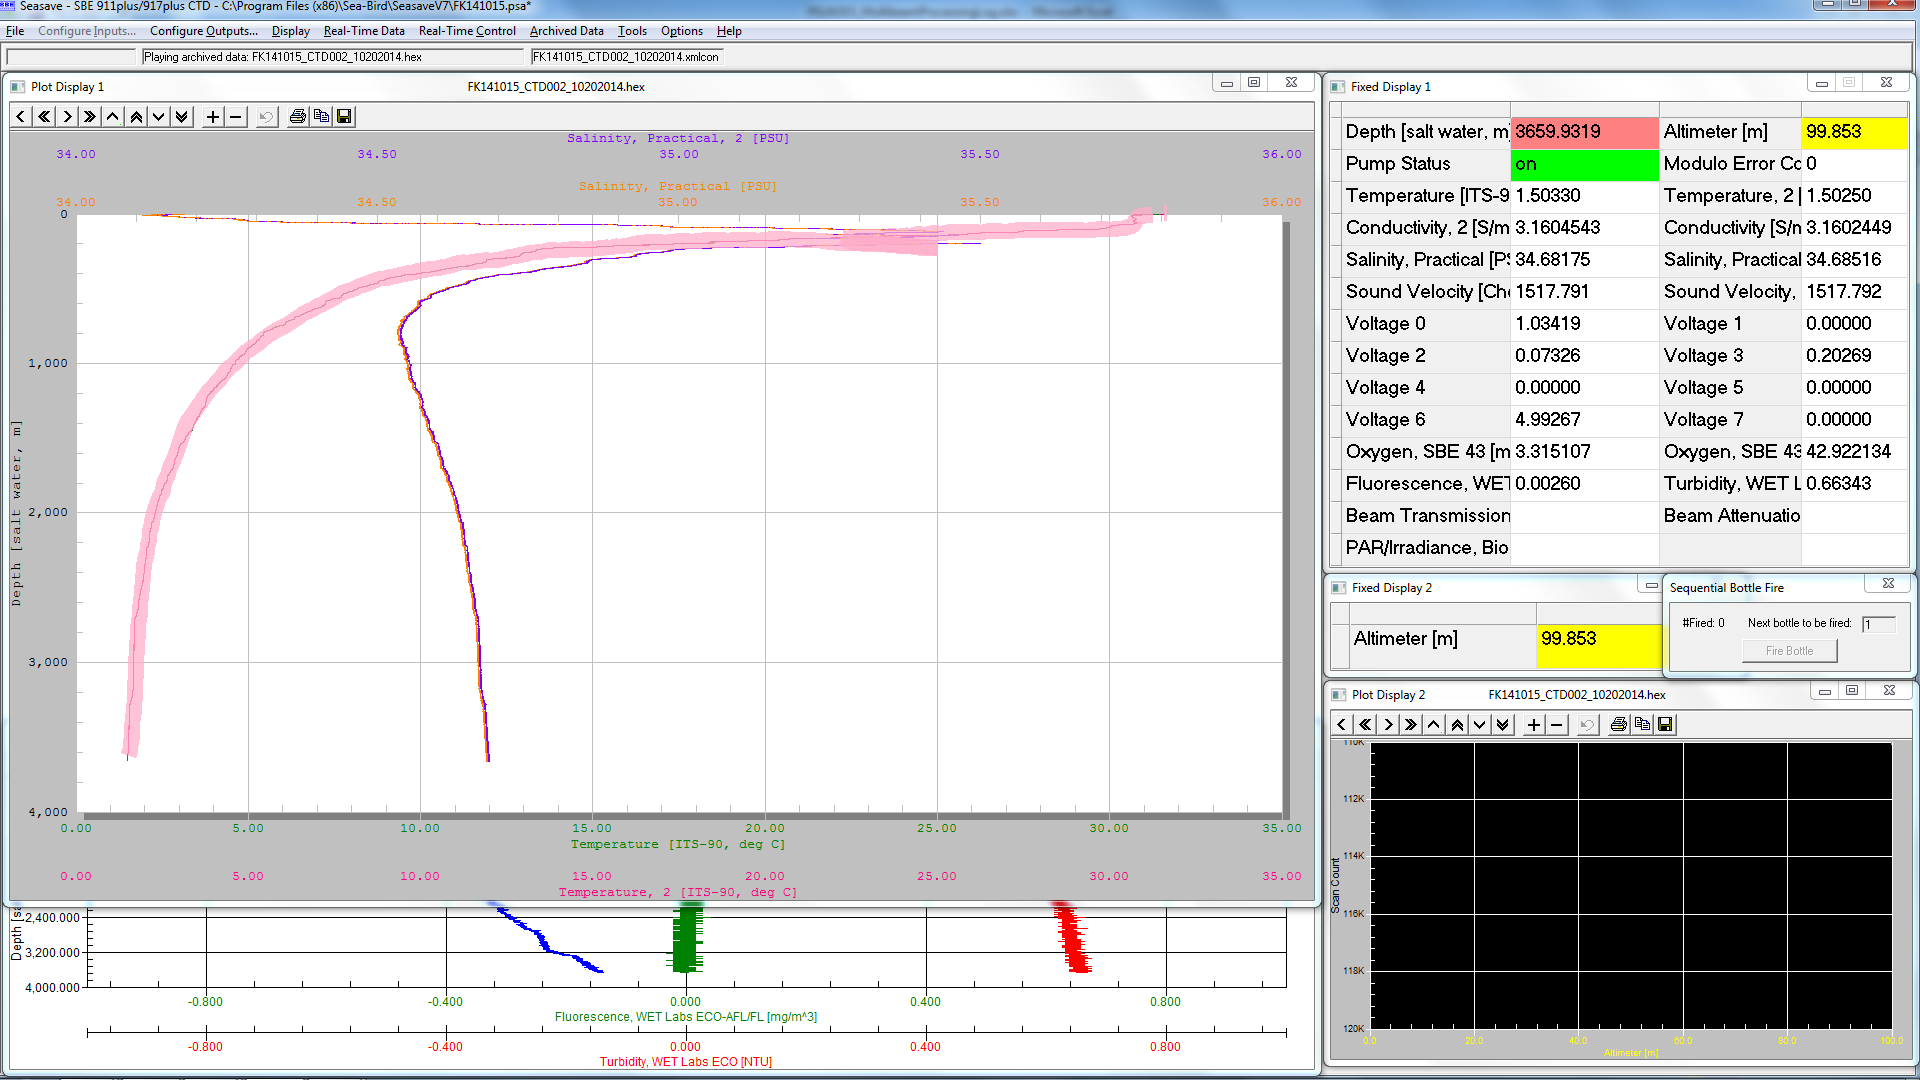
Depth (Y-axis)
Depth is the key parameter to measure throughout a CTD cast. We know where the ship is horizontally on the ocean surface via GPS. Without an accurate reading of depth, the other measurements are fundamentally irrelevant. Additionally, it is essential to have an accurate understanding of the changes in depth to decide when to “fire” (or close) the bottles underwater to collect water samples at specific depths, and to ensure that the CTD doesn’t hit the ocean floor. Embedding sediment or rock into the bottom of the CTD is generally not considered a good practice, so the operator slows the descent when the CTD nears the seafloor. Depth is on the “Y” (vertical) axis in the accompanying
Temperature (pink/green line)
Temperature is probably the most straightforward element of the CTD screen to interpret, with dual sensors being used for data quality assurance and redundancy. As you can see in the screen-shot the temperature of the water at the surface is a balmy 30 degrees Celsius (86 F)! It stays around that temperature in the upper water column until it starts to drop markedly at around 400m (1300ft). This marks the upper boundary of the thermocline, the water layer in which water temperature decreases rapidly with increasing depth. In equatorial regions, the deeper parts of the water column are not influenced by surface activity such as solar radiation, but reflect water mass formation in polar regions. Therefore, deep portions of the ocean are cold globally.
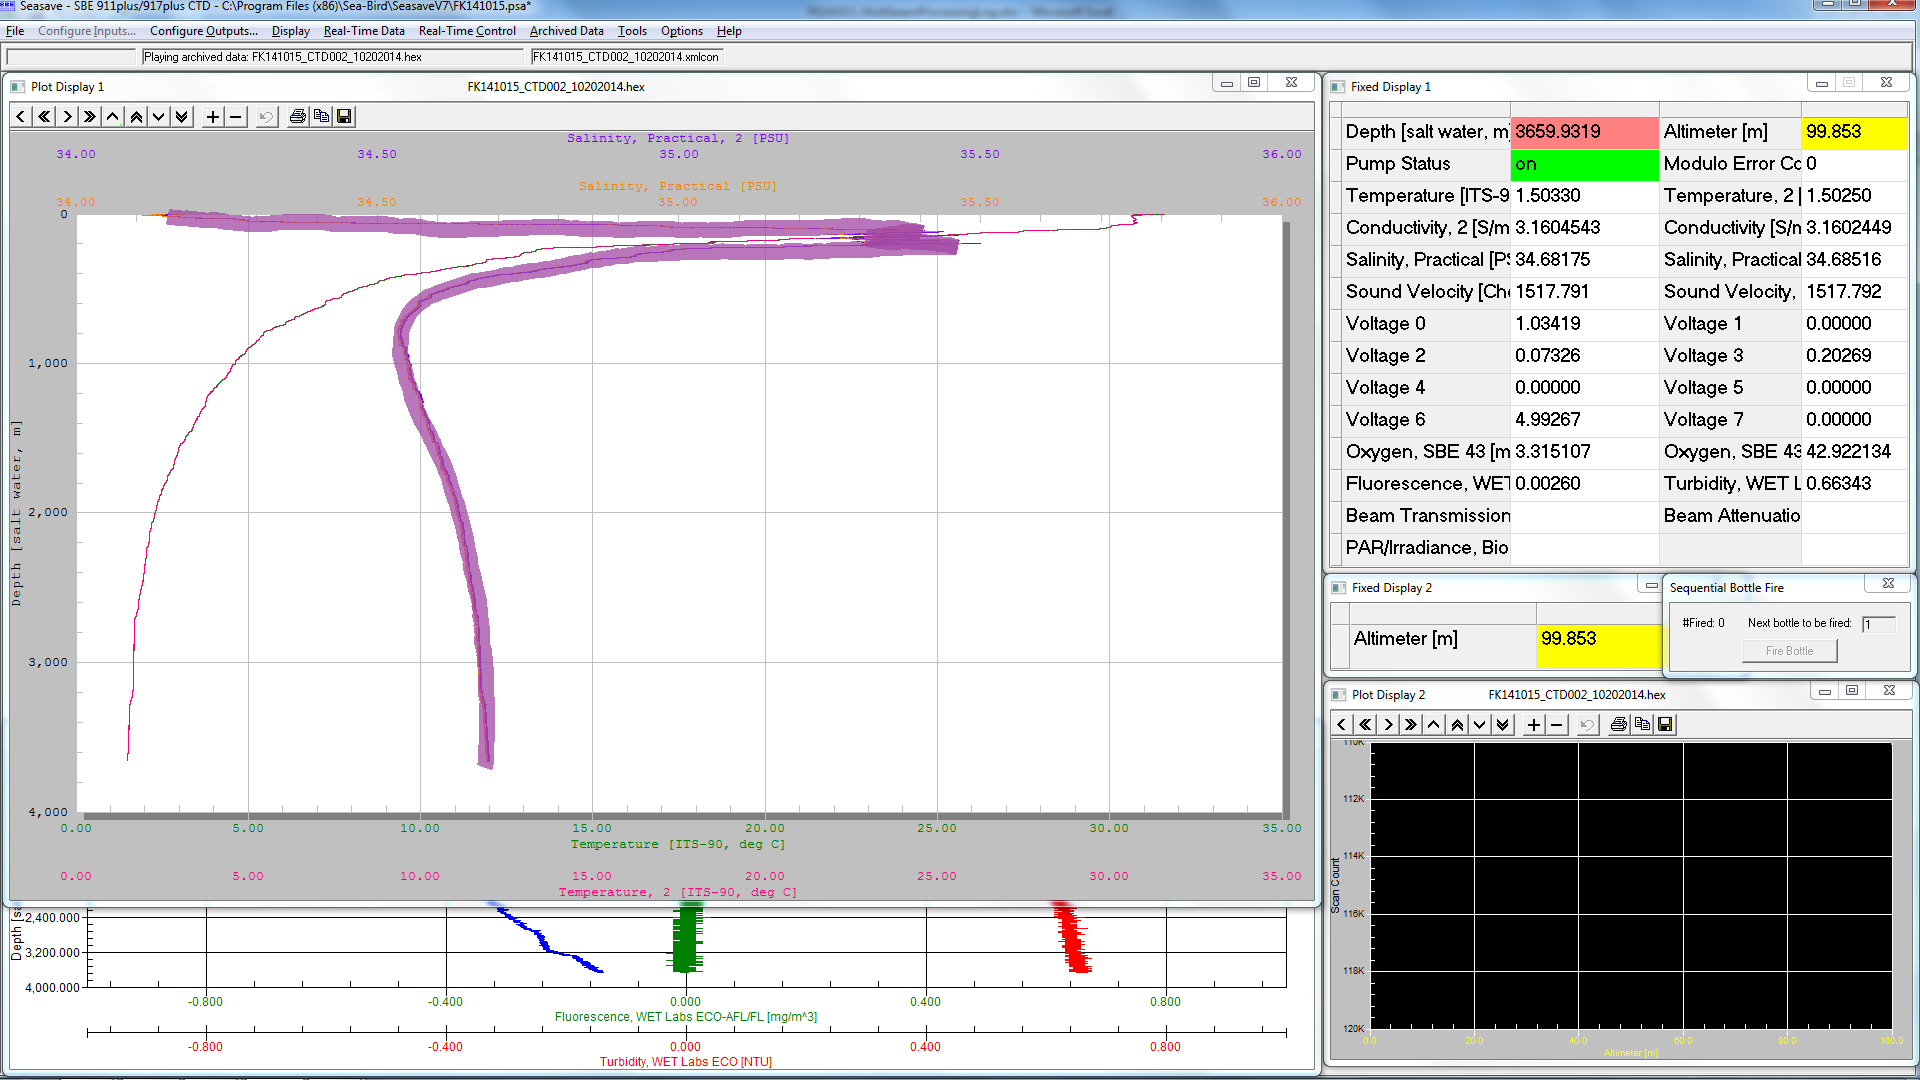
Conductivity (purple/orange line)
Conductivity measurements allow calculation of the salinity of the water. The salinity within this screen-shot shows clear changes with depth. In equatorial regions surface waters have low salinity values due to the strong influence of copious fresh rainwater. Salinity increases rapidly to approximately 200 m (~650 ft), then falls rapidly to a low around 800 m (2600 ft), and then increases gradually again towards the ocean floor.
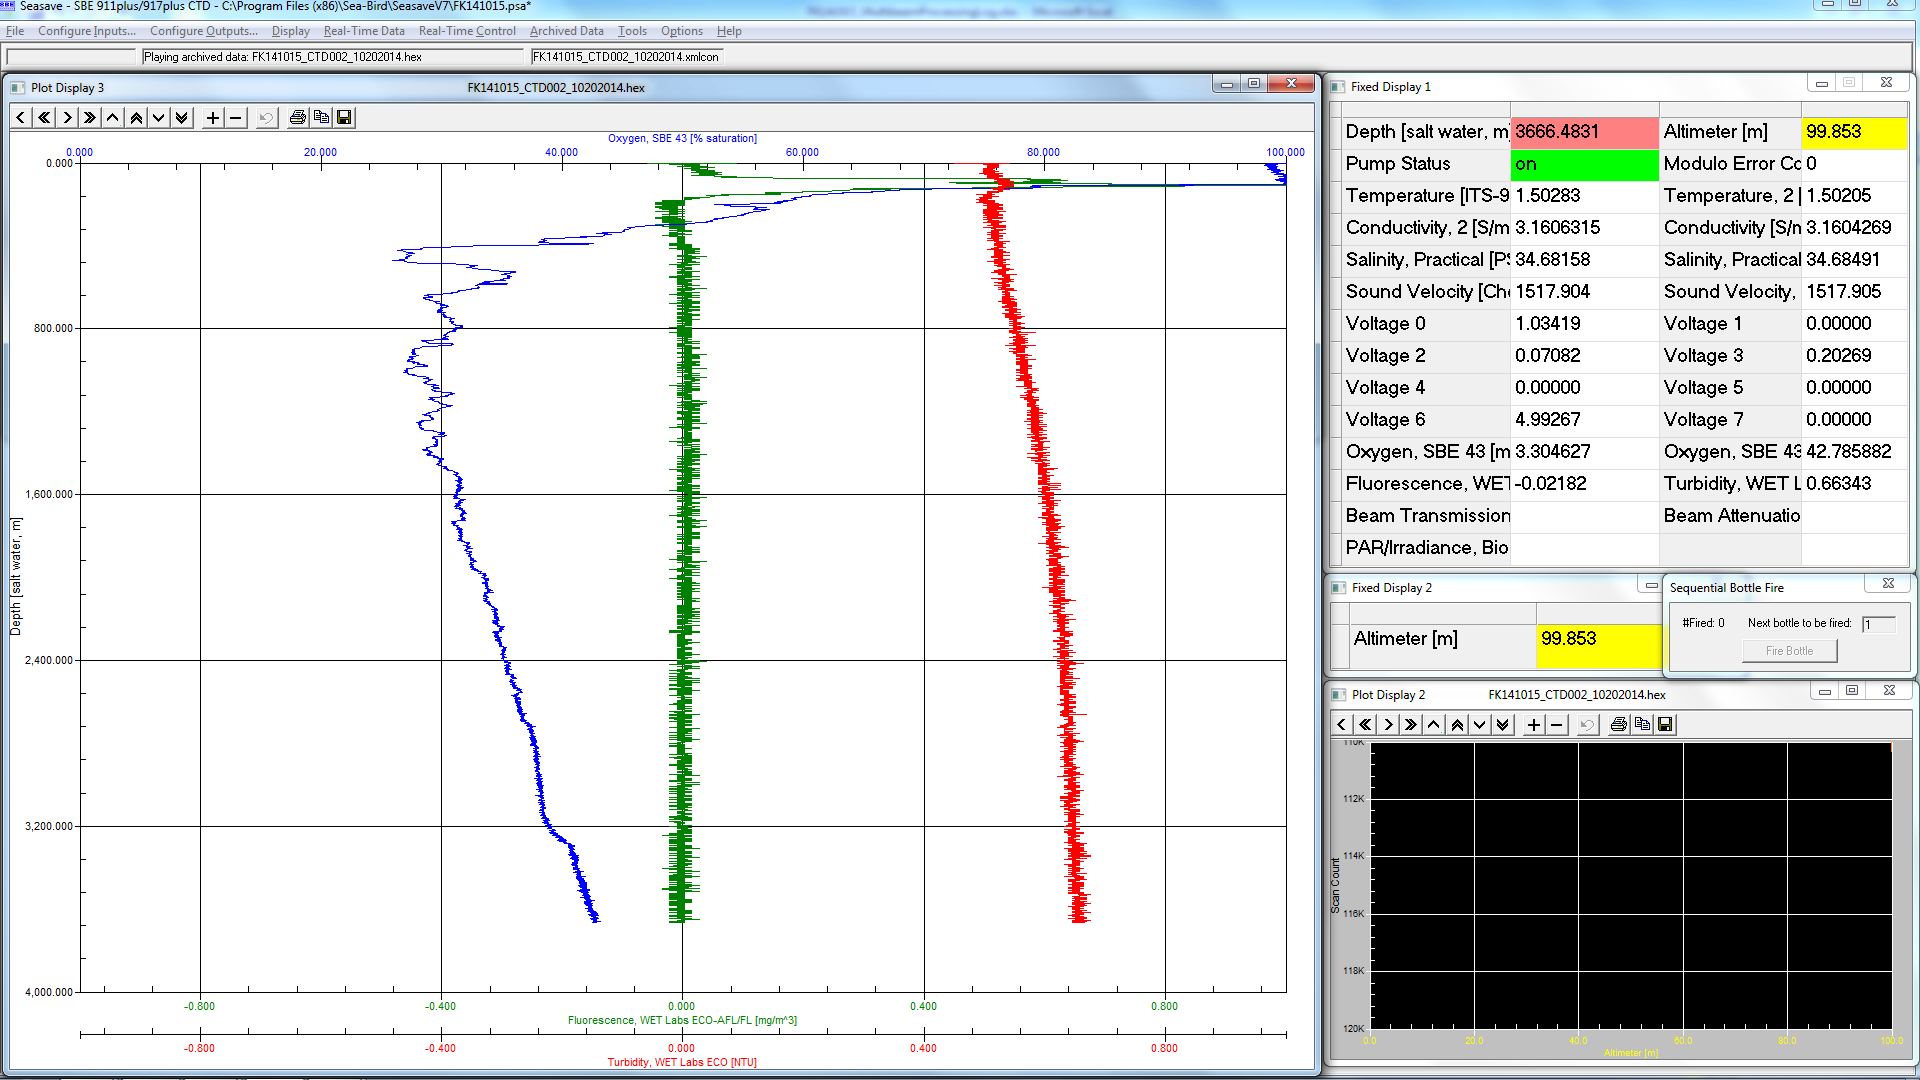
Oxygen (blue line)
The oxygen concentration of the water at any given depth is also a straightforward concept to understand. It is clear from this CTD cast that the oxygen concentration changes significantly with depth. There are high levels of oxygen at the surface, due to mixing from the wind and waves, but these levels decrease with depth, including a large decrease in oxygen around 200 m (~650 ft).
Chlorophyll (green line)
The final measurement of interest on this CTD cast was the chlorophyll, calculated from fluorescence. During some research projects on the Falkor, fluorescence is measured as the CTD descends to determine areas of interest (chlorophyll concentration) so that Niskin bottles can be fired to allow the biologists to investigate the nature and health of the chlorophyll in that area. It is interesting to note that the chlorophyll in these waters peaks just below the surface and rapidly drops off at the base of the photic zone at ~200 m (~650 ft). Chlorophyll relies on photosynthesis for survival and photosynthesis cannot be achieved beneath the photic zone.
Turbidity (red line) was also measured on this cast and follows the same pattern as the fluorescence measurements with a peak caused by the activity surrounding chlorophyll and photosynthesis.
Physical oceanographers define water masses on the basis of distinct temperature and salinity (hence density) characteristics. CTDs allow us to take a 3-D snapshot of these and other parameters to learn more about the water masses, how they interact, and how they change in time and space.