A major science component of our cruise is to utilize the time in transit from Hawaii to Fiji by mapping the seafloor depth, called bathymetry. Since leaving Honolulu Port, the monitors around the ship sync up and display incoming real-time data of Falkor’s high-resolution sea-floor mapping systems. It is a method called Swath Bathymetry, in which a deep-water multibeam echosounder sends acoustic pings from underneath the bow of the ship. These pings bounce off the seafloor and return to the ship, measuring the distance.
Detailing the Deep
I have been intrigued by this constant line on the screens that are identifying our location, movement, and other elemental data, but simultaneously generating a high-resolution image of the seafloor. In the first days of the trip, the monitors displayed a fractured starburst grid surrounded by black. The lines show the many routes of ships leaving or arriving to the Hawai’i Island Chain from the South Pacific that conducted high resolution mapping. From the get-go our ship’s path is strategically plotted between these previously mapped areas – they call it an “edge map” so that we are hitting a new seafloor area and contributing to existing data.
The entire ocean is mapped with low-resolution satellite information that is measured by gravity at the ocean surface. The satellite maps implies large underwater features through values of blue, but these do not show in detail the smaller features of the ocean floor. So at one moment we only have the general essence of what the underwater topography looks like, but then with the pass of our ship we reveal an incredible degree of detail of the ocean floor. It is this moment of the reveal with the mapping line that I find interesting.
I quickly fell under the wing of Marine Technician, Deb Smith. She has a real affinity for seafloor bathymetry and we dove into a couple of the Falkor’s computer software programs to see the mapping data visualization. I asked why it is important to seafloor map. Her answer: “There is so much about the ocean that we do not know – it is important to map to understand the ecosystem and also the habitats that we have yet to discover. Mapping can help us to navigate a vehicle – for example an ROV – to help know the terrain. Also, scientists use high resolution mapping to look at the features in the underlying habitats and know where to look for specimens. But it’s also about exploration, it’s about not knowing what we don’t know yet.” Together we look at our route from Hawai’i to Fiji, and she points out some of the special areas of interest that her team has recommended the captain make a part of the route so we can map. We identity a particular chain of seamounts that we will be passing. I decide to paint these new seamounts, and attempt to capture the reveal in my process.
Map and Masterpiece
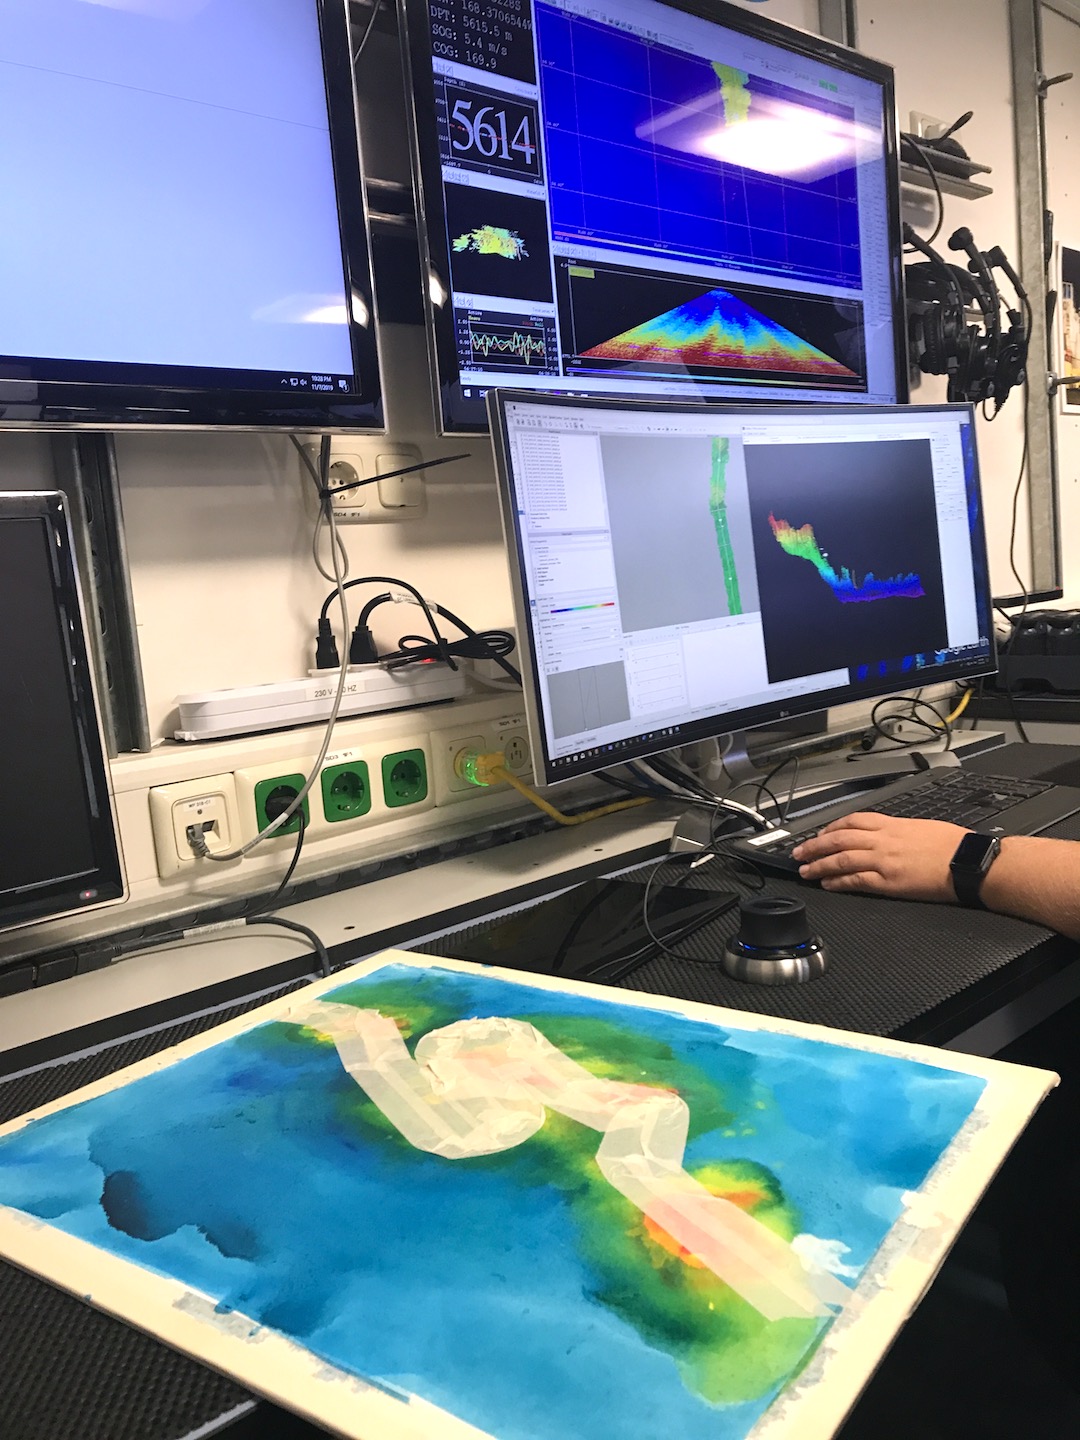
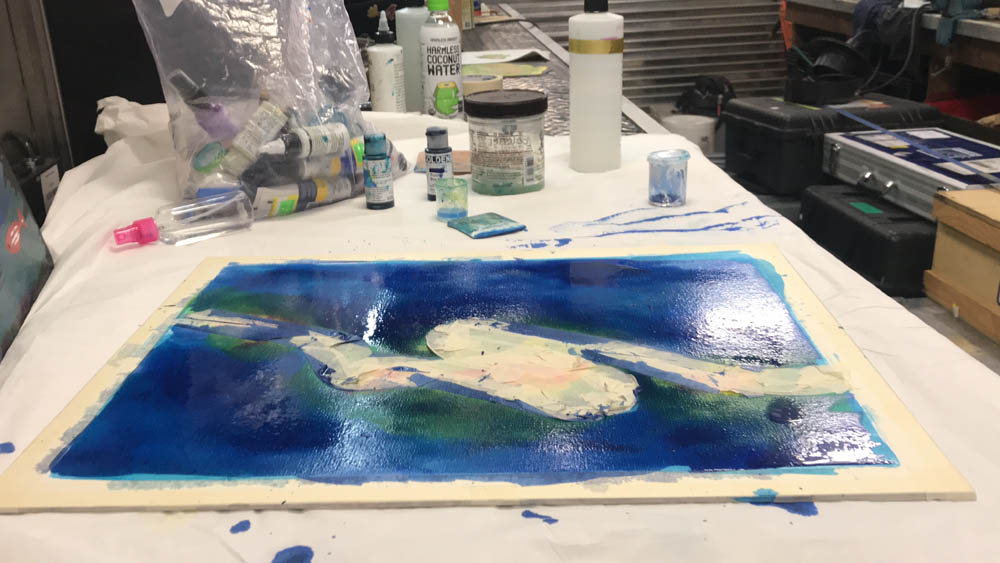
Through the use of the Falkor’s sonar processing software we have a custom color range that shows the elevation we pass over. Typically, the deepest depths (6,000+ meters) are the darkest blues/purples and the shallowest depths (1,000 meters) are interpreted as red hues. Since we have not mapped this area yet, I am only creating what I imagine the seamounts depths to be based on the deep values of the satellite mapping. I use this color coding as a general guideline for my painting. My process begins with painting an undercoat with fluid acrylic, beginning with a watery blue layer, then adding yellow and red. Immediately it creates a three-dimensional view as the paints bleed into each other. Once I confirm our route, I mask it off with tape. I paint in the surrounding area with the darker values of the satellite map, to build up the contrast between the satellite and the high definition sonar mapping.
Next comes “The Reveal” – I take off the masked tape to show the line that is an interpretation of the ship’s path. I removed the tape in the presence of the Marine Tech team, and it was a special moment to for us all to see the new line together. Their reactions were exciting and positive. The line created from the masked tape is not a perfect line due to the paint bleeding but it looks stylistically similar to the bathymetry data which has a tapered edge, not straight or sharp. By this time our full seamount has been mapped and I am able to see and paint in the true details of the ridges and slopes.

I enjoyed this project as it was a visual way to learn about the seafloor mapping and the software data processing. I also love to teach others about art and share the techniques that work for me. So when Deb expressed interest in painting, I invited her to the studio to make a mapping painting in a similar style. It was a total treat, as the conversation flowed from artistic decision making to interpret this highly technical map; such a fresh way to see it. I asked if Deb still gets excited about the reveal when mapping? She does, and she particularly loves to inspect and think about the irregular formations like landslides, sunken donuts holes, and implied ridges.
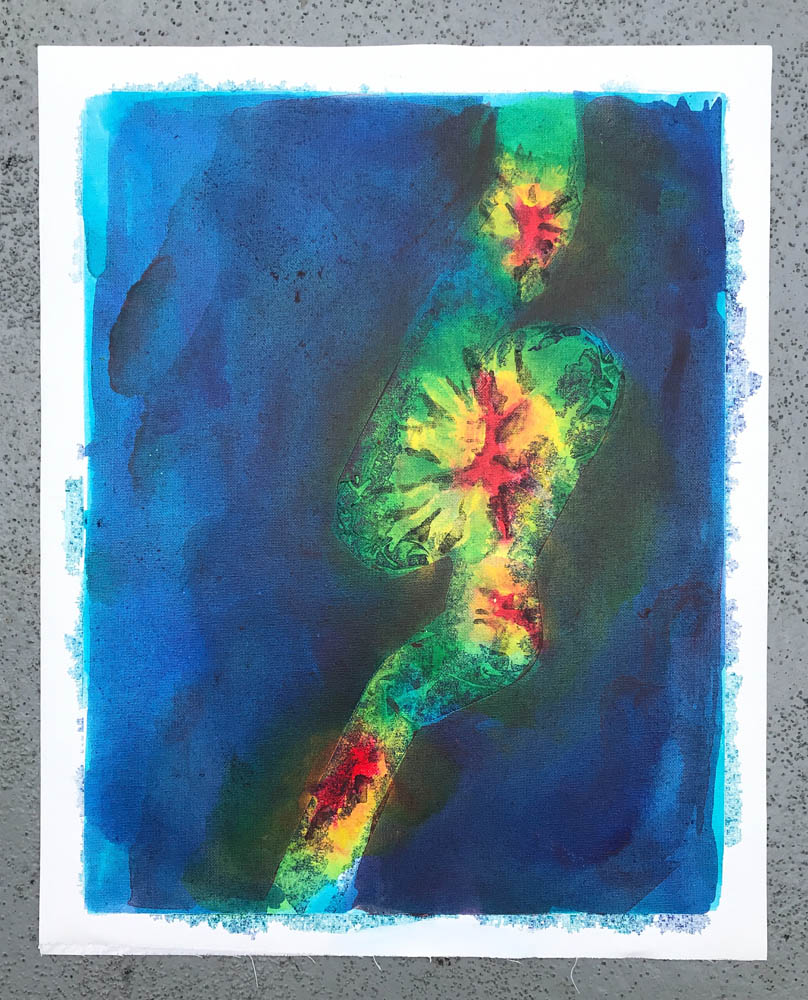
Lastly, for the sake of experimental discovery, I pushed this concept a bit further into painterly abstraction by simplifying the color and putting emphasis on the line. I have been so grateful for the Schmidt Ocean Institute’s artist-at-sea program. I am able to encounter and interact with totally new disciplines and have the freedom to interpret however I see fit. It was rather eye-opening to dive into the world of seafloor mapping and get just a tiny glimpse of what there is to discover on the ocean floor.