The ocean floor – though it covers the majority of our planet – is still more mysterious to us than our closest astronomical neighbors. While satellites orbiting Earth can give us high-resolution images of every point on land, and space probes and telescopes give us detailed photos of the surfaces of other planets, our knowledge of the ocean’s depths is obscured by the ocean itself–water absorbs the light and other electromagnetic waves we need to observe the seafloor, rendering the technologies we use to study the surfaces of faraway planets ineffective.
Tools to Decipher
With visible light and the rest of the electromagnetic spectrum filtered out in the top 200 meters of the water column, the technologies used for deep sea mapping use sound waves to “see” the features on the seabed. These technologies, known as sonar (“SOund NAvigation Ranging”) emit pings of sound from a transmitter mounted on the hull of a ship, which bounce off the seafloor and are picked up by a ship-mounted receiver. The time it takes for the returned sound to arrive back at the ship is used along with the speed of sound to determine the depth of the seafloor at the point where the sound was reflected. R/V Falkor is equipped with a state-of-the-art implementation of this technology, two multibeam echosounders which emit a wide swath of sound beams, covering a wider area at higher resolution than simpler sonar systems. As Falkor travels along the ocean’s surface, the echosounders emit periodic beams of sound, which “paint” the seafloor features as the swath of sound moves forward, revealing details of the seafloor at a much higher resolution than other technologies.
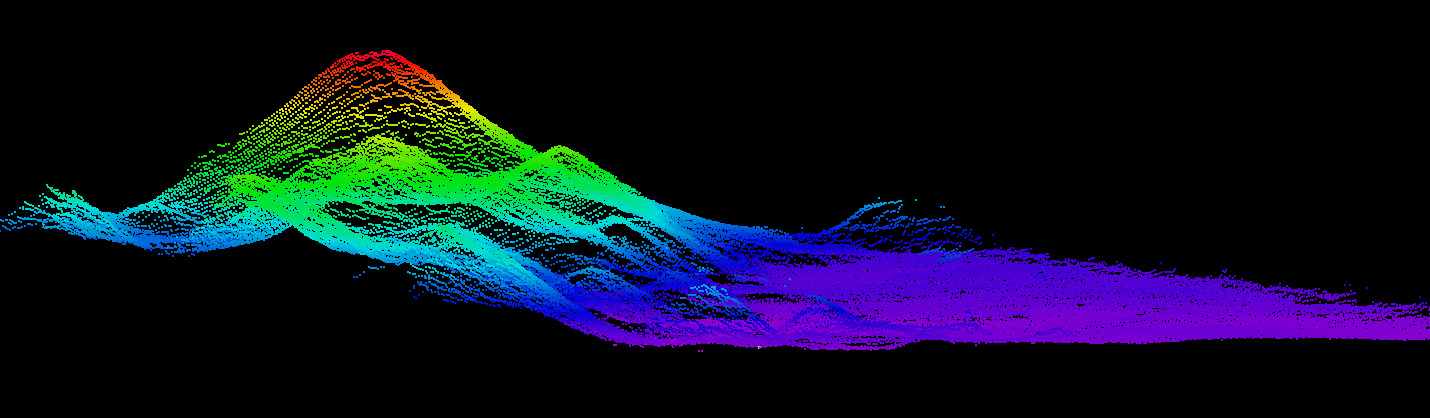
The results of the multibeam mapping approach are highly dependent on the estimate of the speed of sound. The speed of sound underwater depends on the salinity of the water, the temperature, and the depth, all of which need to be measured in order to create a sound velocity profile which is used to calculate the time it takes for sonar beams to bounce off the ocean floor. The salinity and temperature information can be obtained from the World Ocean Atlas, a global dataset of oceanographic data which includes the salinity and temperature profiles needed to calculate the speed of sound. Much of this data comes from the Argo Program, a global array of profiling floats which drift freely with the ocean currents, periodically diving to 2000m to collect temperature and salinity data from the water column, then returning to the surface and relaying the data via satellite. These floats enable near real-time, continuous monitoring of ocean conditions, revolutionizing our ocean monitoring capabilities. Additionally, the mapping technicians aboard Falkor sometimes use a probe called an XBT (Expendable BathyThermograph) to determine the temperature profile of a water column. The XBT consists of a weighted probe with a temperature sensor, which measures the temperature of the surrounding seawater as it falls to the ocean’s depths. This is useful for getting a more accurate temperature profile in the exact mapping location or in areas where less Argo float data is available. With an accurate sound velocity profile corresponding to the conditions of the area being mapped, the multibeam echosounders yield accurate, low-noise three-dimensional data of the features of the sea floor.
Span and Size
The trade-off of this higher-resolution mapping approach is the size of the resulting mapped area. While the maps created by the multibeam echosounders are high resolution (on the order of tens of meters), these swaths of high-resolution bathymetry are only at most 1-2 kilometers wide. Even with thousands of ships mapping the seabed we have mapped less than fifteen percent of the total ocean floor at high resolution. Areas like shipping routes are thoroughly mapped due to continuous ship traffic, while other areas have never been mapped by multibeam sonars before.
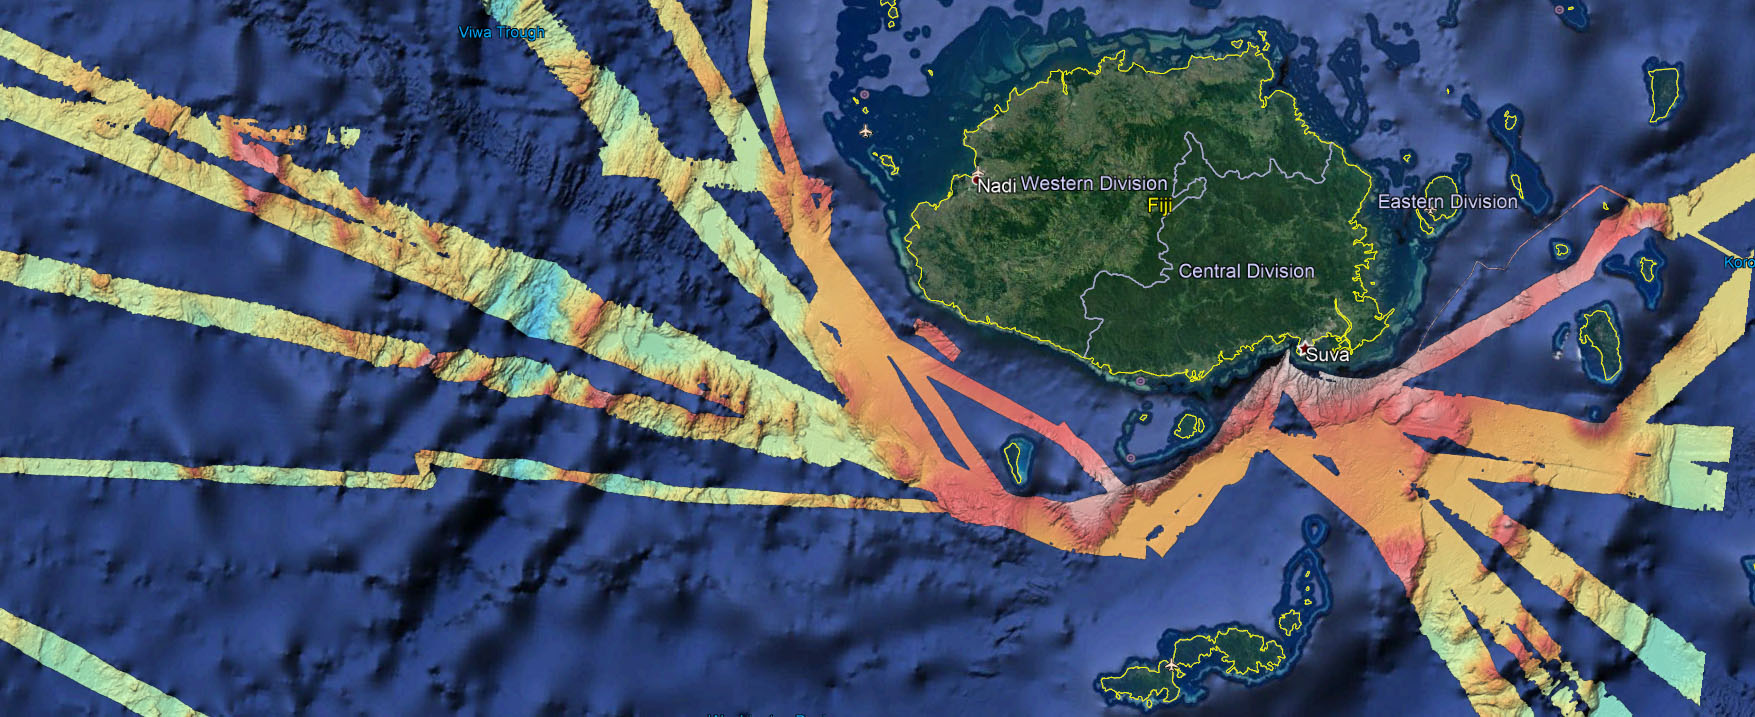
Much like the Argo float program revolutionized oceanography by enabling continuous monitoring of ocean processes, having a complete map of the seafloor will revolutionize our knowledge of our oceans. While there is still a long way left to go, the mapping data collected by Falkor on this transit from Hawaii to Suva will fill in some of the gaps our high-resolution maps, as the oceanographic community collectively works towards a vision of a better understood ocean.