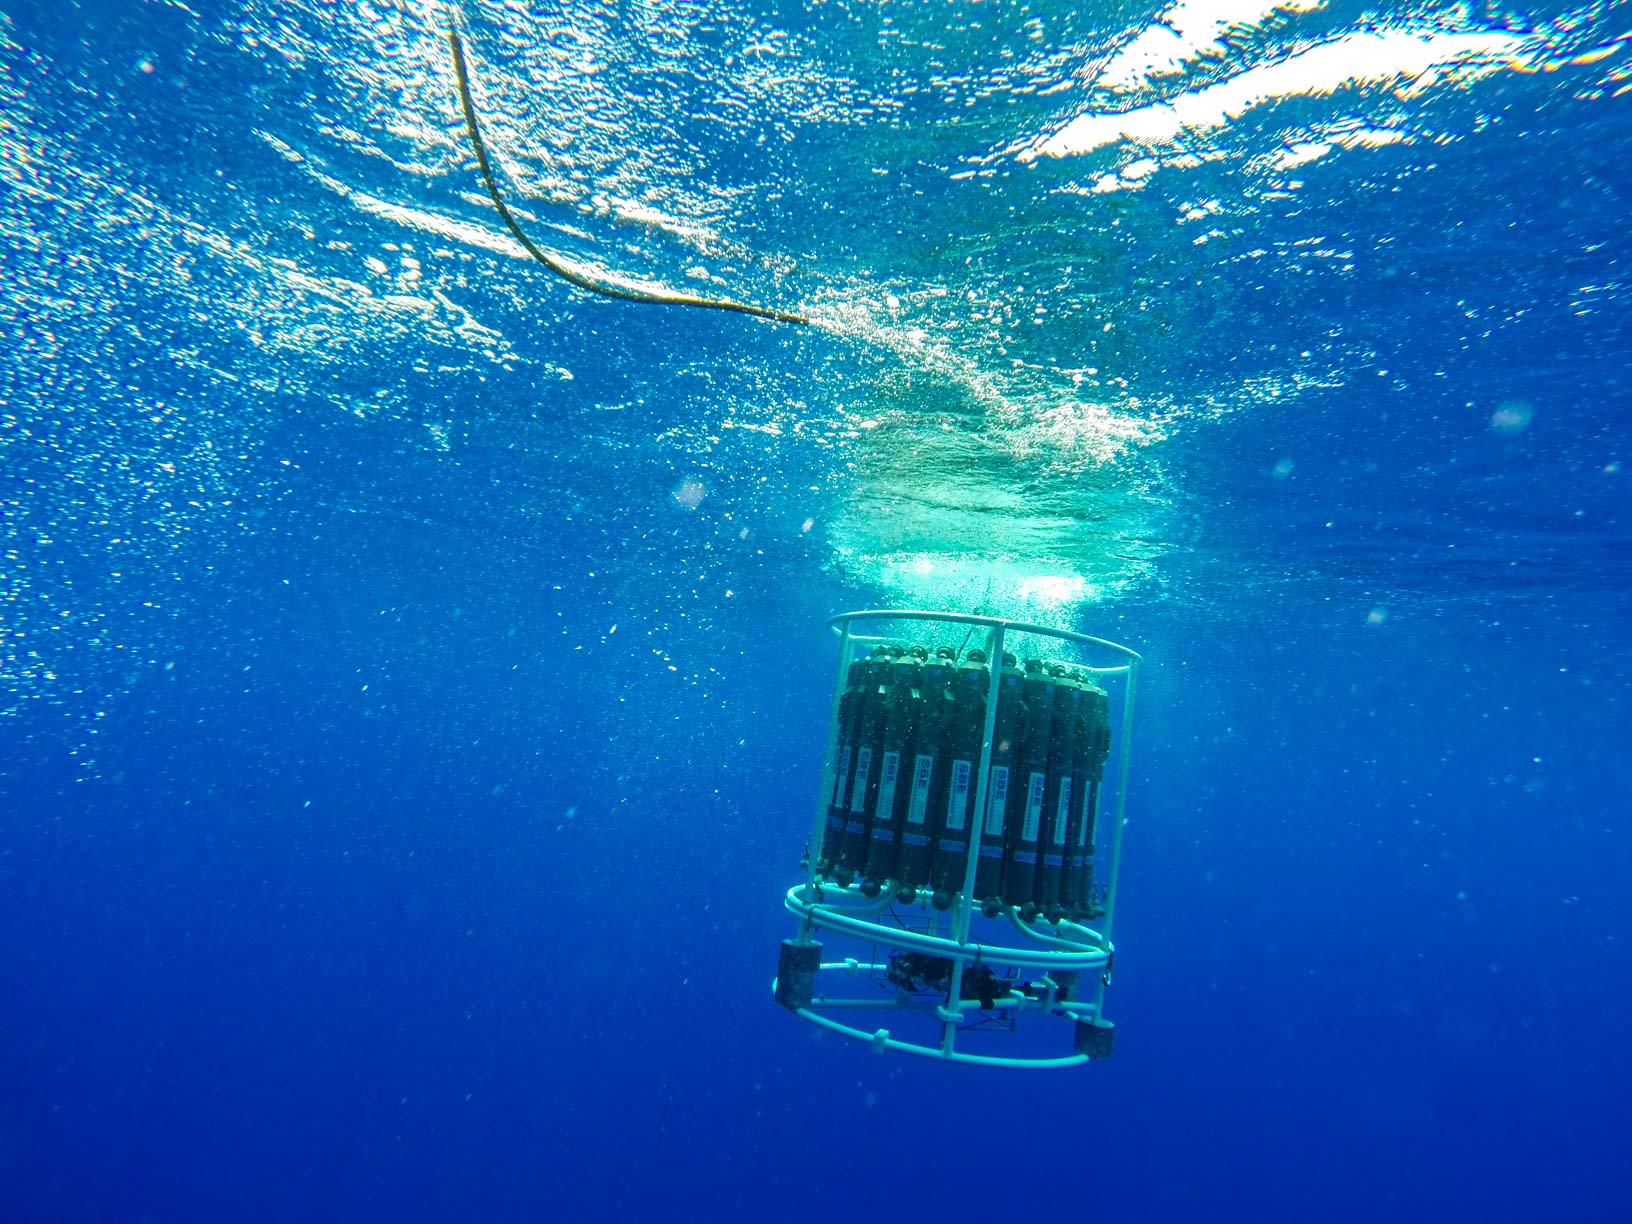
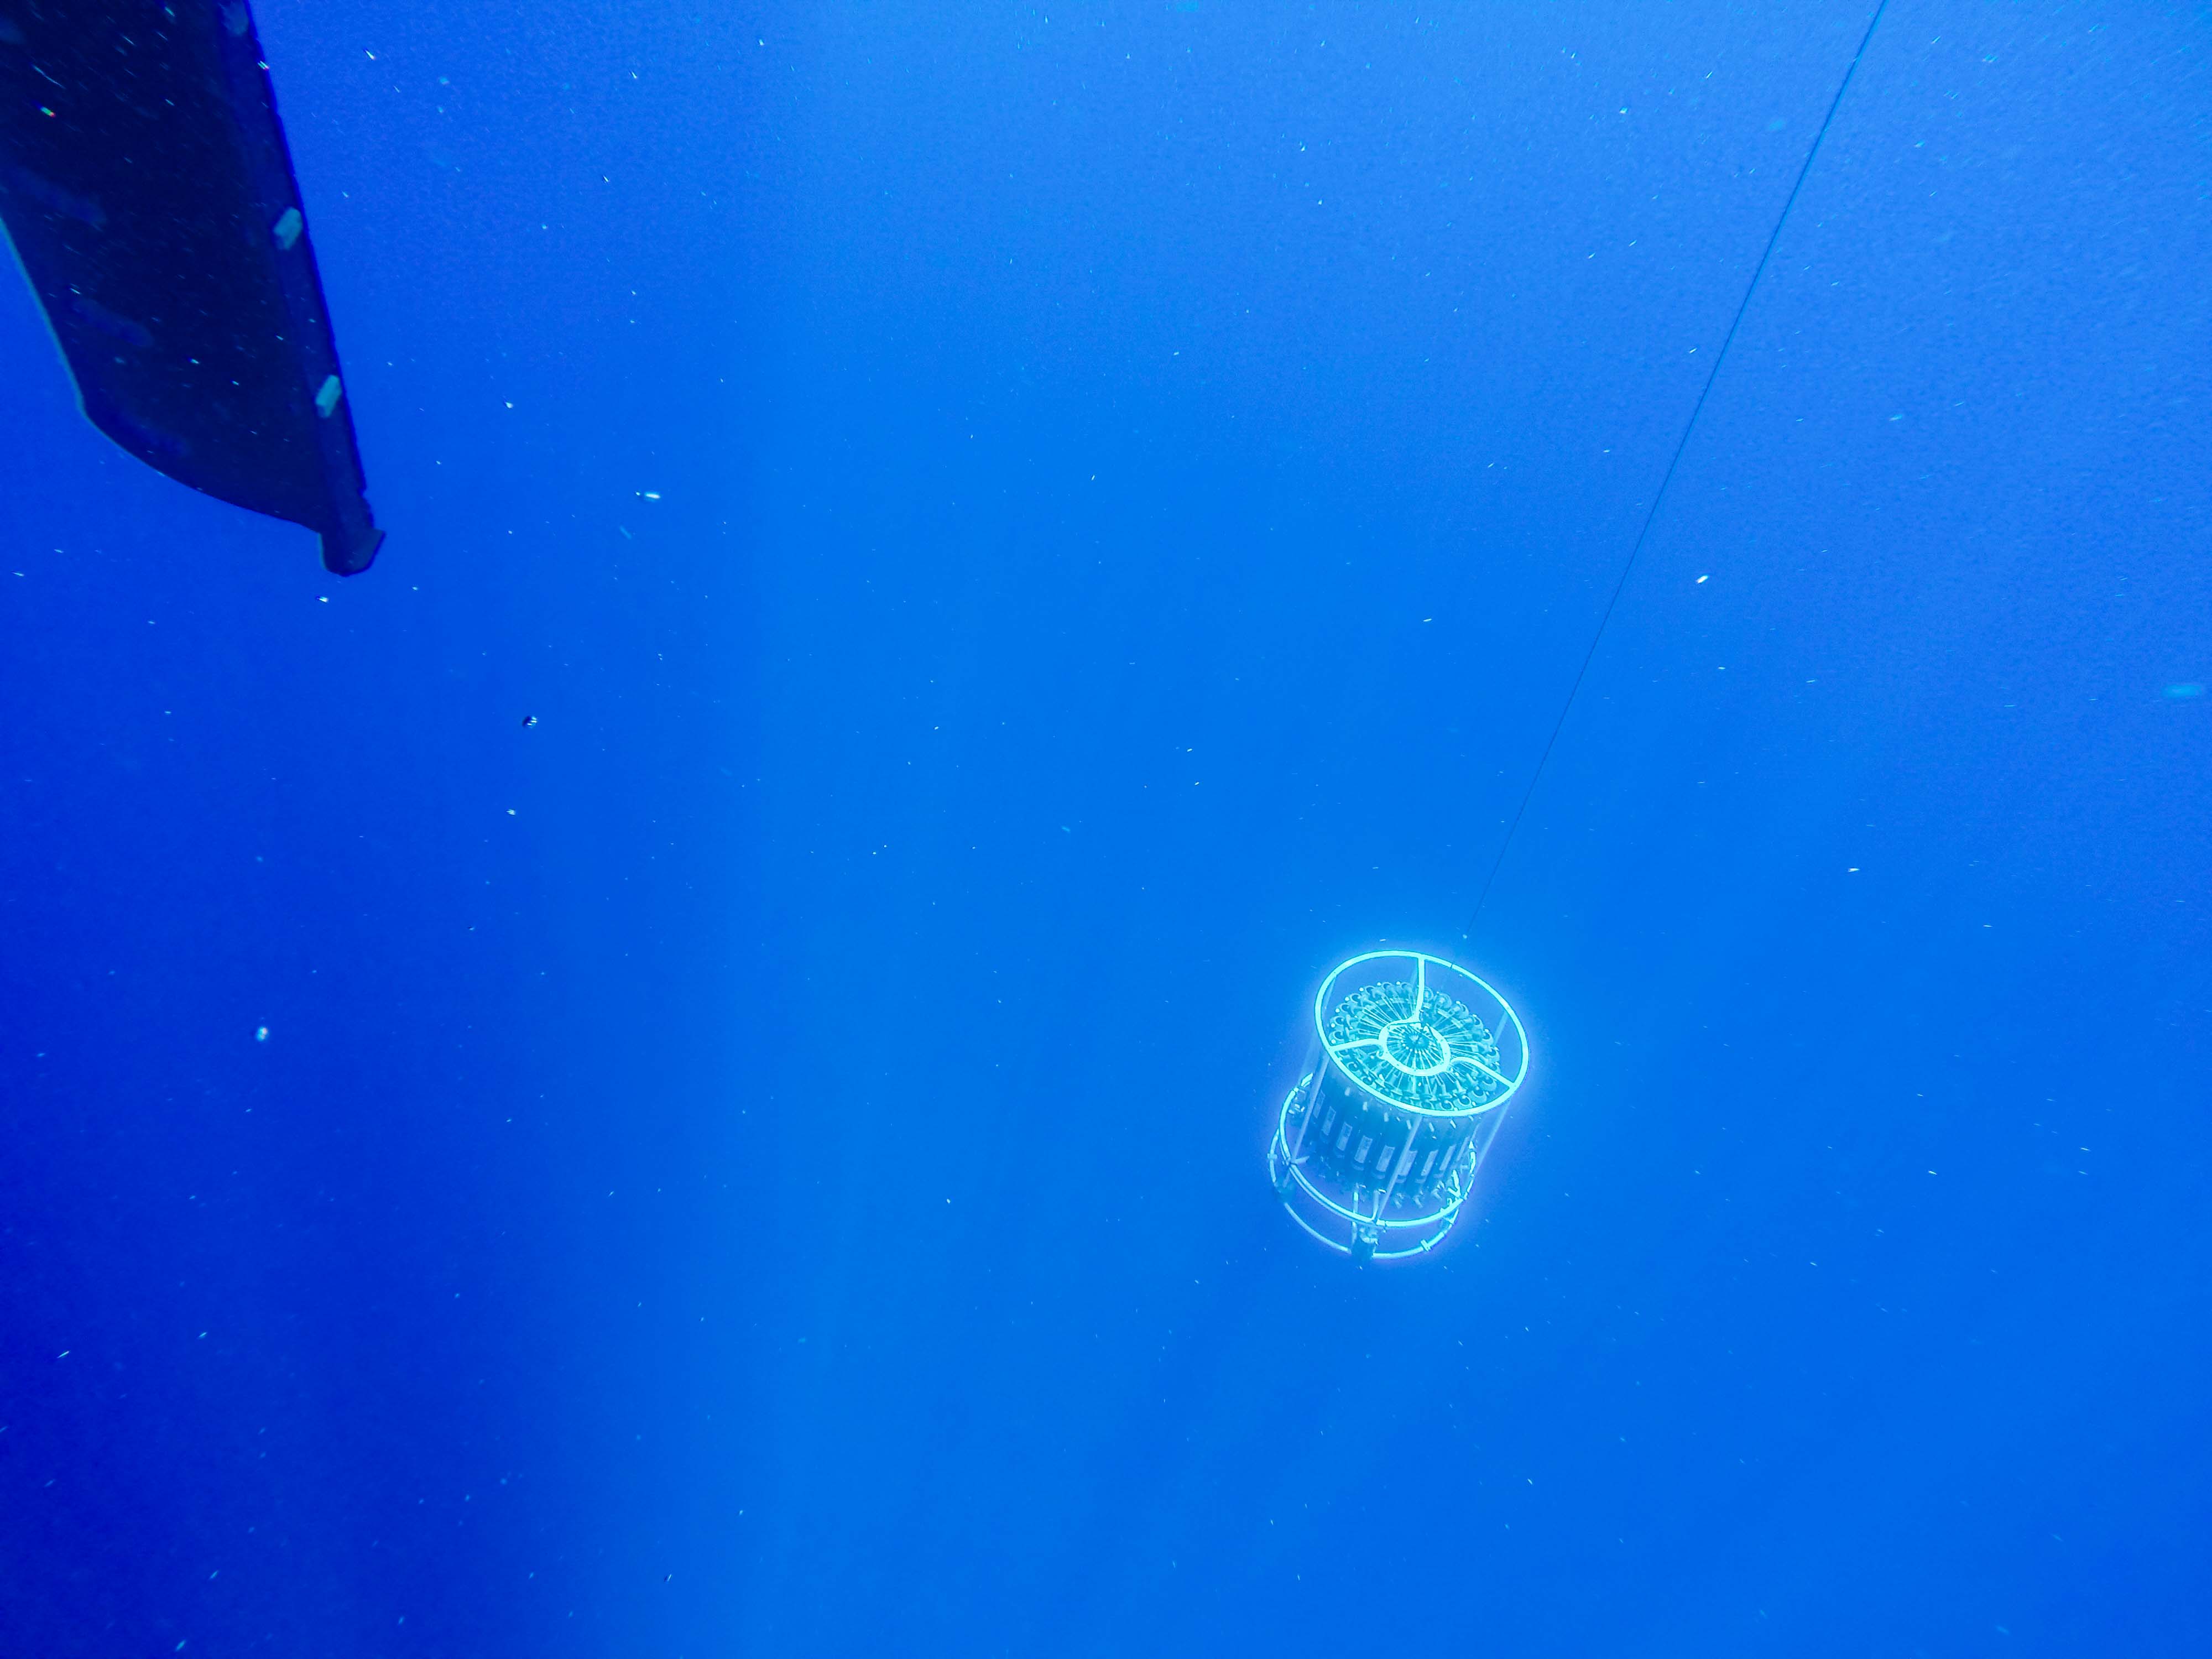
We have arrived at the Ontong Java Plateau and to properly map the seafloor we needed to know more about the physical characteristics of the water above it. To do this, the science crew typically deploy a CTD rosette (array). CTD stands for conductivity, temperature, and depth. Since the electrical conductivity of water relates directly to the amount of salt in the water, in a basic sense, the conductivity sensor measures salinity. The saltier the water, the better it conducts an electrical charge. As the CTD is lowered into the ocean, the primary sensors give a profile of the changes in temperature and salinity for each depth.
Why Temperature and Salinity Matter for Mulitbeam Mapping
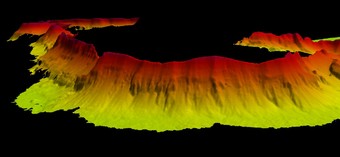
Changes in temperature, salinity, and depth (pressure) matter because we will be mapping the plateau’s seafloor utilizing reflected pulses (‘pings’) of sound from Falkor’s multibeam echosounder. As each pulse of sound travels to the ocean floor and back to Falkor, the distance to that particular section of bottom is calculated by measuring the exact amount of time it takes. If the travel time increases, the area is getting deeper and a feature such as a submarine canyon may be coming into view. Shorter travel times indicate that a ridge or seamount might be rising up from the deep.
The velocity at which a sound wave travels is related to changes in the density and compressibility (elasticity) of the material it travels through. Both density and compressibility of seawater change with changes in temperature, salinity and pressure. In ocean waters, increases in temperature, salinity or pressure result in increases in velocity.
The largest changes in temperature and salinity are found close to the surface. In the upper layers of the ocean, the effects of temperature and salinity are more important than the effect of pressure. Deeper in the ocean, temperature and salinity change less with depth, and changes in pressure become the most important factor.
 Simply stated, a ‘ping’ of sound does not travel down and back to the ship at the same velocity through out its travels. For the mulitbeam echosounder to make highly accurate measurements of distance from the ship to the ocean bottom, the temperature, salinity and pressure profile for that particular piece of ocean must be known from sea surface all the way to the seafloor and back to calculate the expected sound interval for any given depth. Hence the need for CTD data.
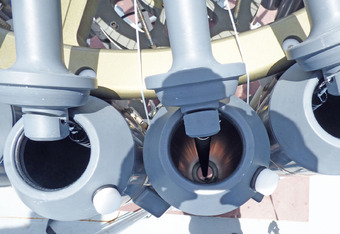
The CTD array can carry many other sensors to measure oxygen level, pH levels, or other physical and chemical characteristics. In addition, the array holds 24 open ended plastic cylinders, called Niskin bottles after the oceanographer who patented them, that are triggered to snap shut at differing depths, collecting water samples. Today our primary concern, however, is obtaining an accurate profile of the changes in temperature and salinity through the water column overlying the Ontong Java Plateau. The Niskin bottles will just be going along for the ride.
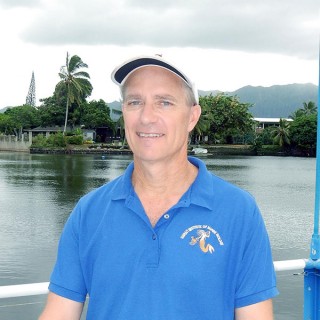
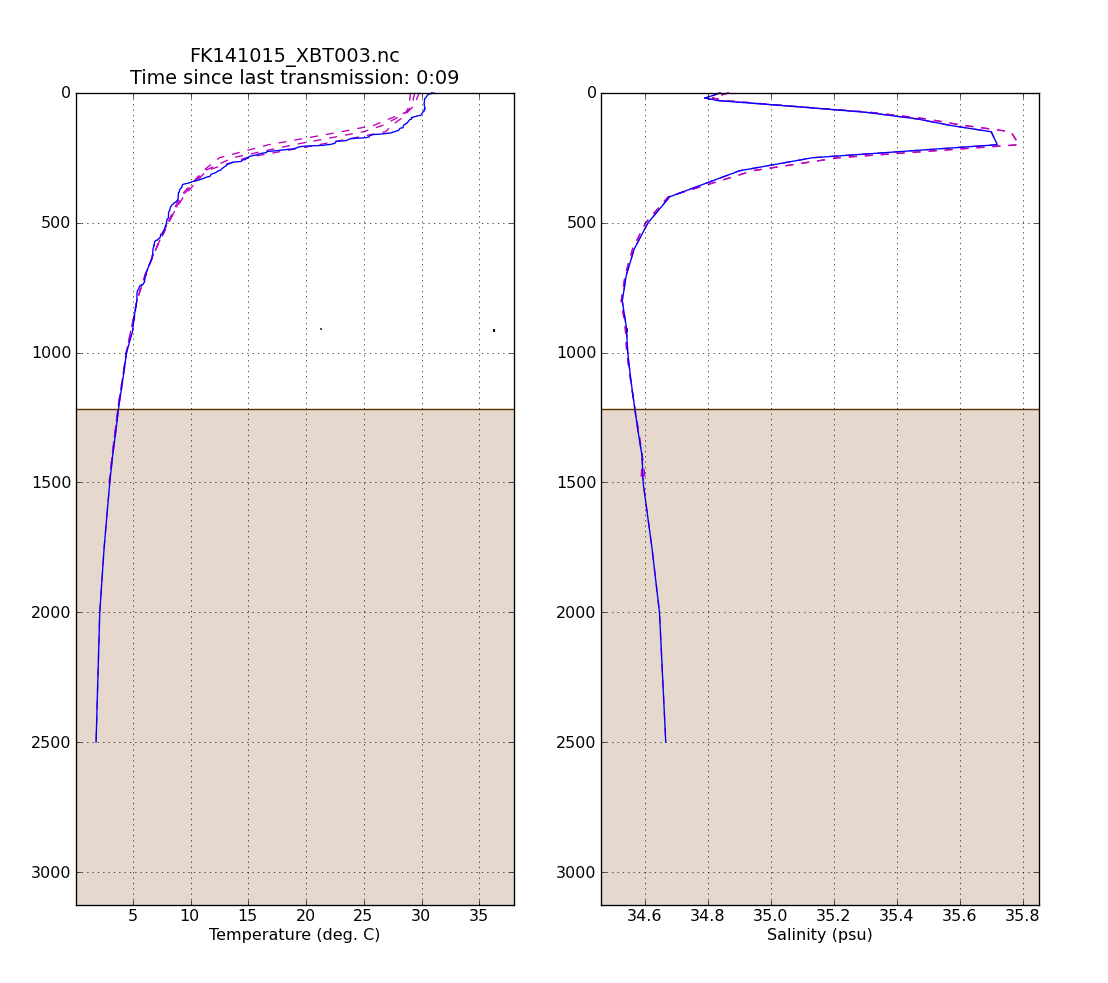
 Out on the aft deck, A.J. from the science team and Falkor crew put on steel-toed shoes, hard hats, and life vests to deploy and retrieve the CTD (safety first!). As the CTD was lowered, other science team members monitored the control room screens. Although it began well, unfortunately in this case the data flow failed and we had to launch a XBT (expendable bathythermograph) which provided much of the same information but not to the same depths as a CTD can reach. Note the drop in temperature with depth and the changes in salinity from the XBT data above. On oceanographic plots such as these, the surface of the sea is at the top of the graph and depth increases towards the bottom. By 600 meters, temperature and salinity have begun to show a predictable pattern of change. These data are sufficient for calibration and it is time to continue to map uncharted seafloor!