Out here in the Tasman Sea, chasing the internal tide involves a lot of detective work, piecing together clues from water velocity, temperature, and density to determine where exactly the tide beam is heading. Scientists know from 20 years of satellite altimetry (sea height) data where it is most likely to be, based on estimations of energy flux. But there are a lot of factors that come into play that can affect the direction of the beam, including the physical characteristics and shape of the deep sea ridge where the internal tide is generated.
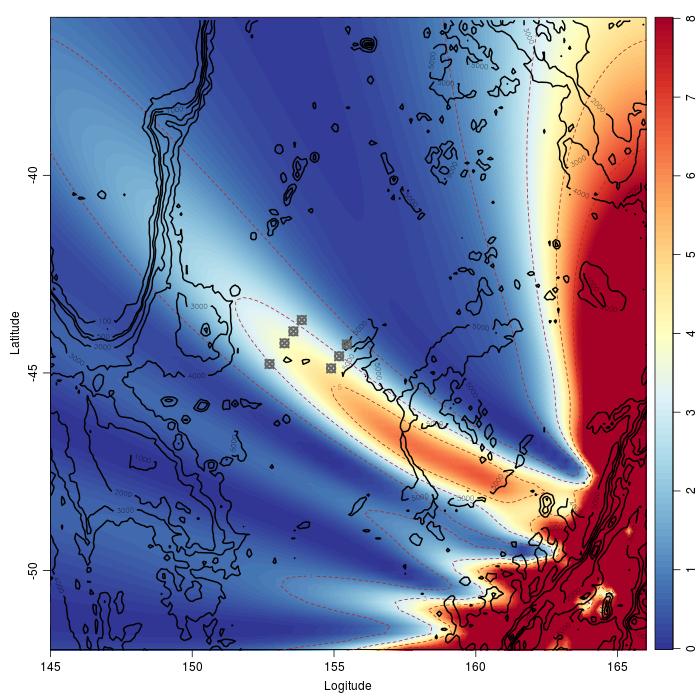
Dmitry’s model illustrating the “bending” of the T-Beam across the TasmanDmitry Brazhnikov
This is where mathematical modeling is again helpful. Modeling allows scientists to create a visualization of a complex phenomenon that integrates multiple sources of data with theoretical physics. The current state of the art model to describe ocean circulation, including internal waves, is called the MITgcm model (created at MIT in Boston, MA). On board Falkor, Dmitry Brazhnikov is using this model to generate a hypothesis that will describe the pathway of the T-Tide beam after it is generated on the Macquarie Ridge. Having an accurate picture of the direction of the beam is very important for understanding how it will interact with and reflect off of the Tasman Continental Slope. Starting with the satellite altimetry data to define one geographic section (domain) of the beam, Dmitry then began adding velocity and temperature data from this cruise into the model to re-prescribe the parameters of the MITgcm model to fit the specific conditions for the Tasman internal tide. This process is called data assimilation and is extremely useful for improving the accuracy of numerical models, and for exploring the behavior of a system/phenomenon when you don’t have the luxury of making direct observations on every aspect of it.
Internal waves can occur in any medium where there is a strong difference in densities. Dmitry Brazhnikov admires the cloud formations created by an internal wave in the atmosphere.Luc Rainville
A Bending Beam
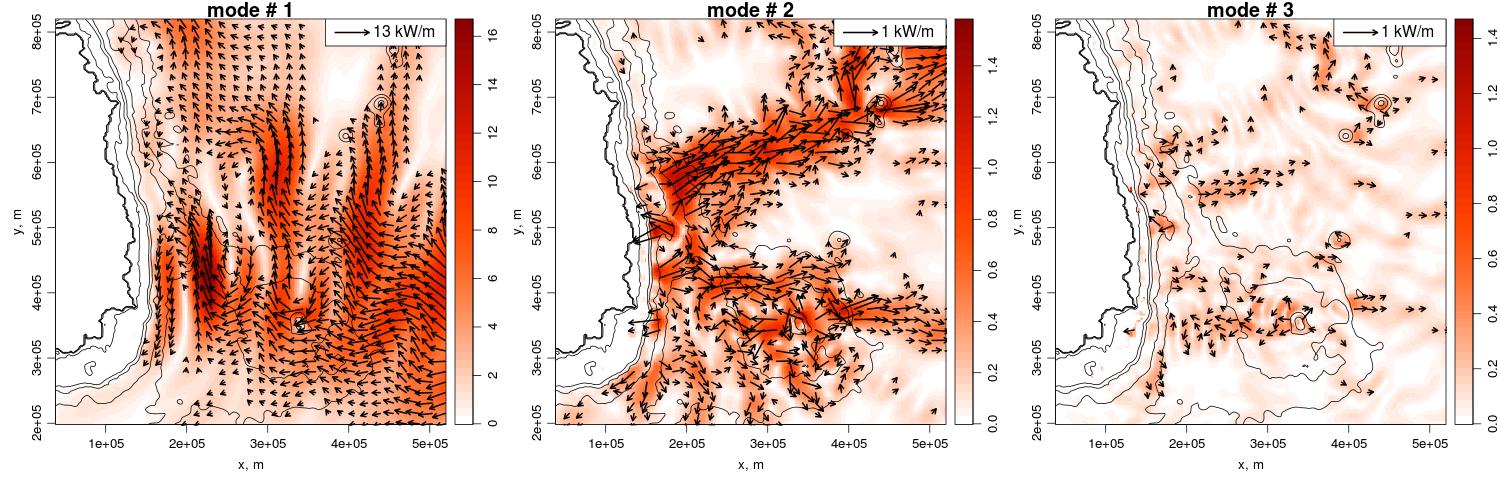
Although the weather has not been entirely cooperative, the T-Tide science team have still been able to collect a good amount of velocity and temperature data that offer a glimpse of where the T-Beam is. As we mentioned previously, the highest water velocities at the depth we would expect to see the internal tide seem to be located somewhat north of where the original model using satellite altimetry data had indicated. Dmitry is now using those data to create new simulations of the beam, and is getting some very interesting preliminary visualizations. Rather than simply taking a more northward course directly from the point of origin, the model shows the beam “bending” toward the north as it progresses across the Tasman Sea. Physicists categorize waves into “modes” according to their vertical structure, which defines the energy, wavelength, and stability. Dmitry’s model shows that as the T-Beam wave moves toward and encounters the Tasman Shelf, the energy from the internal wave transitions from a long wavelength, stable mode 1 wave (which can be propagated over long distances), to a mode 2 wave (shorter wavelength and less stable) and then to a mode 3 wave (even smaller wavelength and stability). The energy from the mode 3 wave is likely entirely dissipated on the continental shelf.
Modeling the Future of Oceanography
None of these simulations would be possible during the course of a research cruise without the help of a “supercomputer”, which is essentially a computer with very high computing power and processing speed. This cruise, the T-Beam team is fortunate to be able to use the Nebula system, a cloud-based supercomputer recently installed on Falkor. Dmitry believes that supercomputers will help advance oceanographic research by allowing scientists to adapt a cruise plan while at sea, depending on what the real-time data are indicating. This could have real implications for biological oceanography where scientists might want to predict the location of, say, zooplankton communities, over the course of a cruise. Or use this dynamic modeling to help locate hydrothermal vents based on chemical and temperature signals in the water column. In the future, there is the potential for substantial savings of time and money by being able to identify ocean features and phenomena while researchers are actually at sea, rather than waiting to analyze and visualize the data back in their laboratories.