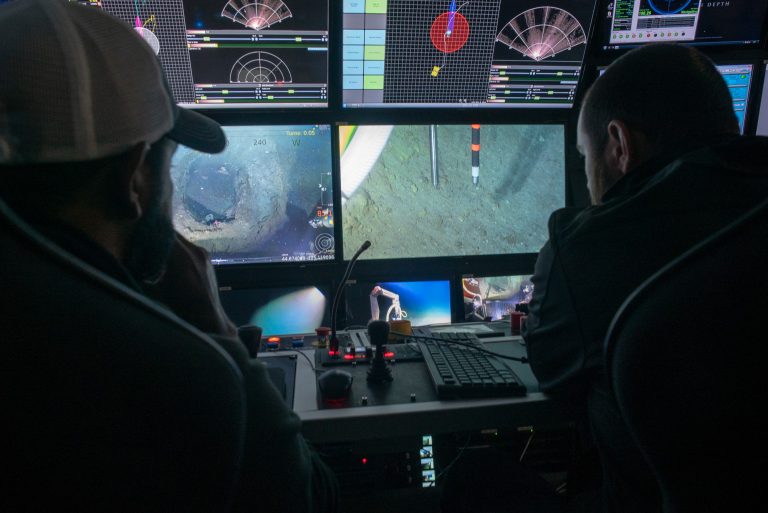
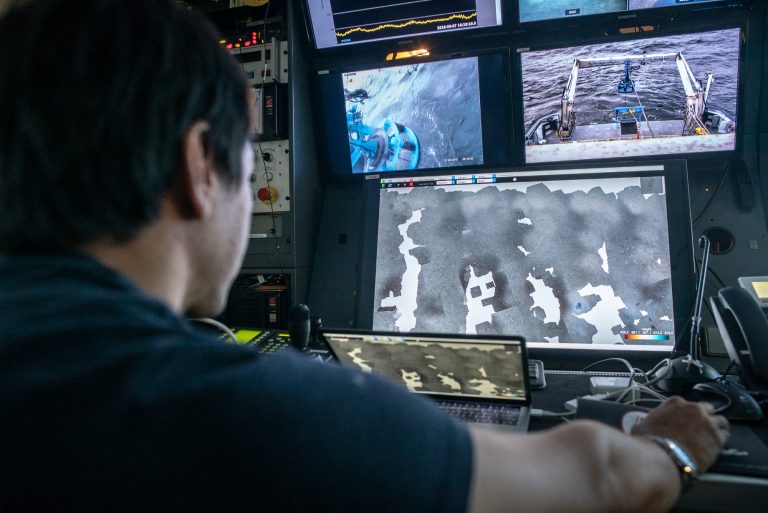
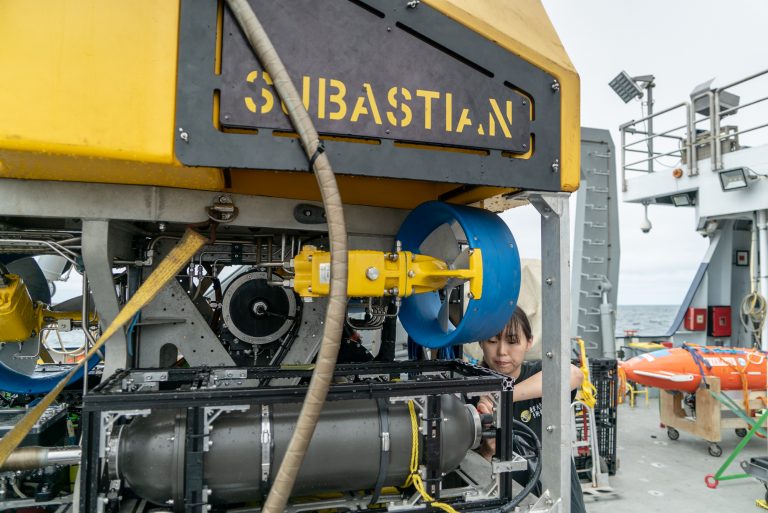
Now that all of our three AUVs have been successfully deployed and taken more than 1,000,000 images of the seafloor, it is ROV SuBastian’s turn to hit the water. Artificial intelligence has run unsupervised clustering of those images, showing us the distribution of similar features on the seafloor. That information is fundamental for us to choose the most relevant places to send SuBastian. Our chemical sensor, a Raman spectrometer, has been mounted on one of SuBastian’s manipulator arms, so we can carry out our in-situ chemical analysis of the deep-sea floor.
Gourmet Palate
The Raman spectrometer can “taste” the chemical compounds of basically anything, such as gas, liquids, or even solids. It is a gourmet, in that it can even tell us how strong each “flavor” is – i.e. how high the concentration of a certain compound is.
In this expedition, we are performing measurements of pore water, the water interlaced within the sediments of the seafloor. We have already succeeded in taking in-situ real-time measurements of pore water in hydrothermal vent fields, back off of Japan in 2017. At that time, we detected CO2 gas at a depth of over a thousand meters and measured the sediment sub-surface depth profiles of SO42- concentration. A depth profile is a graph that shows how a certain water property changes with depth from an interface. For instance, a depth profile of sea water temperature shows how that property changes from the sea surface to the sea floor.
Hydrate Ridge
Today, we are exploring Hydrate Ridge with SuBastian. Here, a massive amount of methane gas hydrates exist “sleeping” under the seafloor. Gas hydrates are the focus of much attention because of their scientific significance, as well as their potential industrial use. Interestingly, gas hydrates are considered one of the largest organic carbon reservoirs on Earth, which means they play a crucial role in the global carbon cycle. Beyond that, they might save our lives as future natural energy resource.
Yet, determining the amounts and distribution of hydrates is very challenging. Hydrates are often covered with sediments, hidden from us. While analysis of sampled cores can give us a lot of information, degassing during sample recovery prevents us from knowing the real contents of samples taken. Our mission is to measure the chemical compounds of the porewater in the Hydrate Ridge while on-site and try to see what is going on under the seafloor. We are also interested in tying this together with the biological activity seen above the sediments, looking for patterns in their relative distribution.
Turning Data Into Understanding
Based on the visual maps created from the images acquired by the AUV dives, we are now able to see how the Hydrate Ridge looks, in great detail. We have found both exposed and hidden hydrates, as well as several holes drilled during the Ocean Drilling Program, which was a global project to study our natural environment. By measuring the chemical compounds in the porewater (mainly CH4, CO2, and SO42-) we will visualize the dynamic chemical gradient under the seafloor in this area.
Gaining better understanding of hydrate fields is important for policy-making, conservation and science research. This research is also a meaningful step towards advancing the way we explore and understand our oceans, which are the beating heart of our planet.