In a few clicks, without even leaving our offices, we could be 3,660 meters underwater – looking at the animals and microbes living at hydrothermal vents in the Gulf of California in a way no single ROV dive could accomplish. On this research expedition, the type of tools that enabled us to explore the surface of Mars will be used to advance the science of the deep here on Earth.
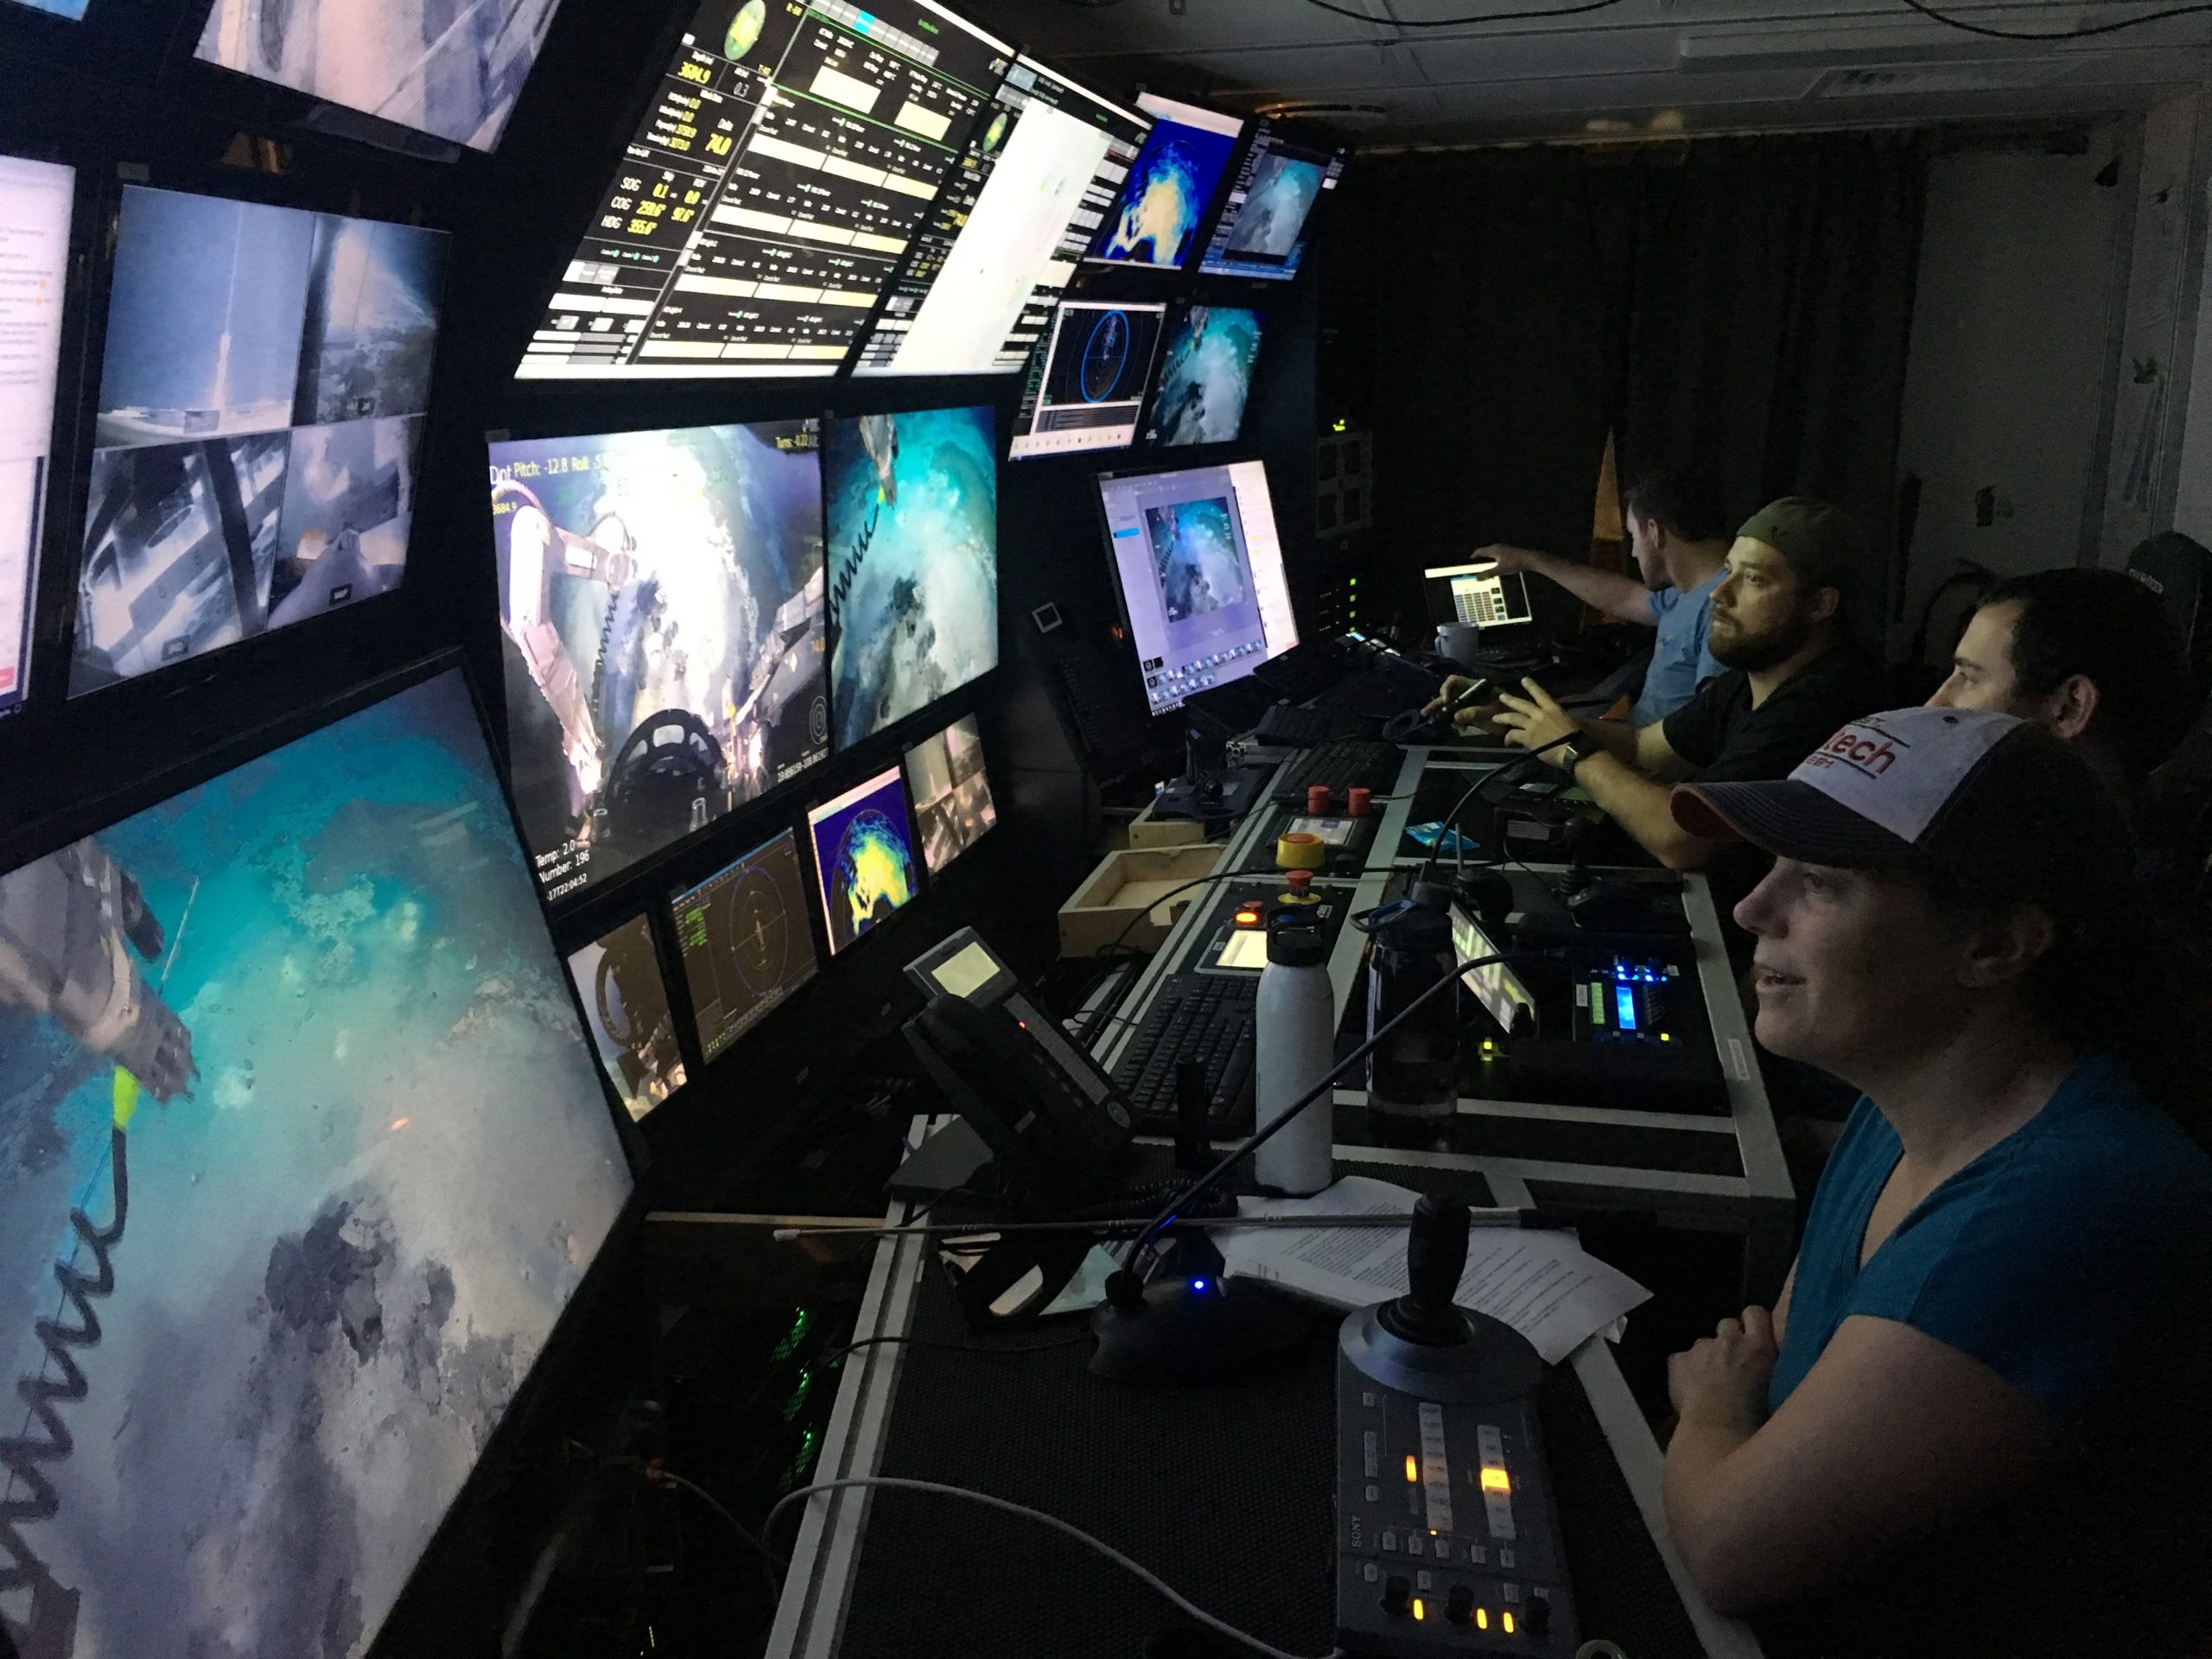
Studying life at the bottom of the ocean is no simple task – if only because it is a world we can only experience through the eyes of submersibles for a short period of time. The moment ROV SuBastian dives beneath the waves, a 12-hour clock begins to tick down and the scientists, in tandem with the rover pilots, must carefully select where to go and what samples to take.
Thus begins a science “triage” that merges observations and decisions made in real-time with the objectives and sampling plans drafted up before the ship left port. This is often a fun, but daunting task. How do you synthesize everything you have observed in the past and reconcile it on the spot with what the ROV cameras are showing? How can we ensure that each bacterial mat or rock sample is the best step we can take towards answering the mysteries of life living on the edge?
Cue the pathfinding work done by exploration of the Martian surface. Through the power of programming and design, Martian scientists are able to combine all the data they have collected – satellite images, topography, rover mineral/chemical analyses – to formulate a strategic plan and visualize it in a computer tool that allows them to see the forest through the trees. This tool is the very tool used when crunch time hits – when the “tactical” window begins and satellite communications only gives them 8 hours to work with the rover drivers to decide where and what they will sample.
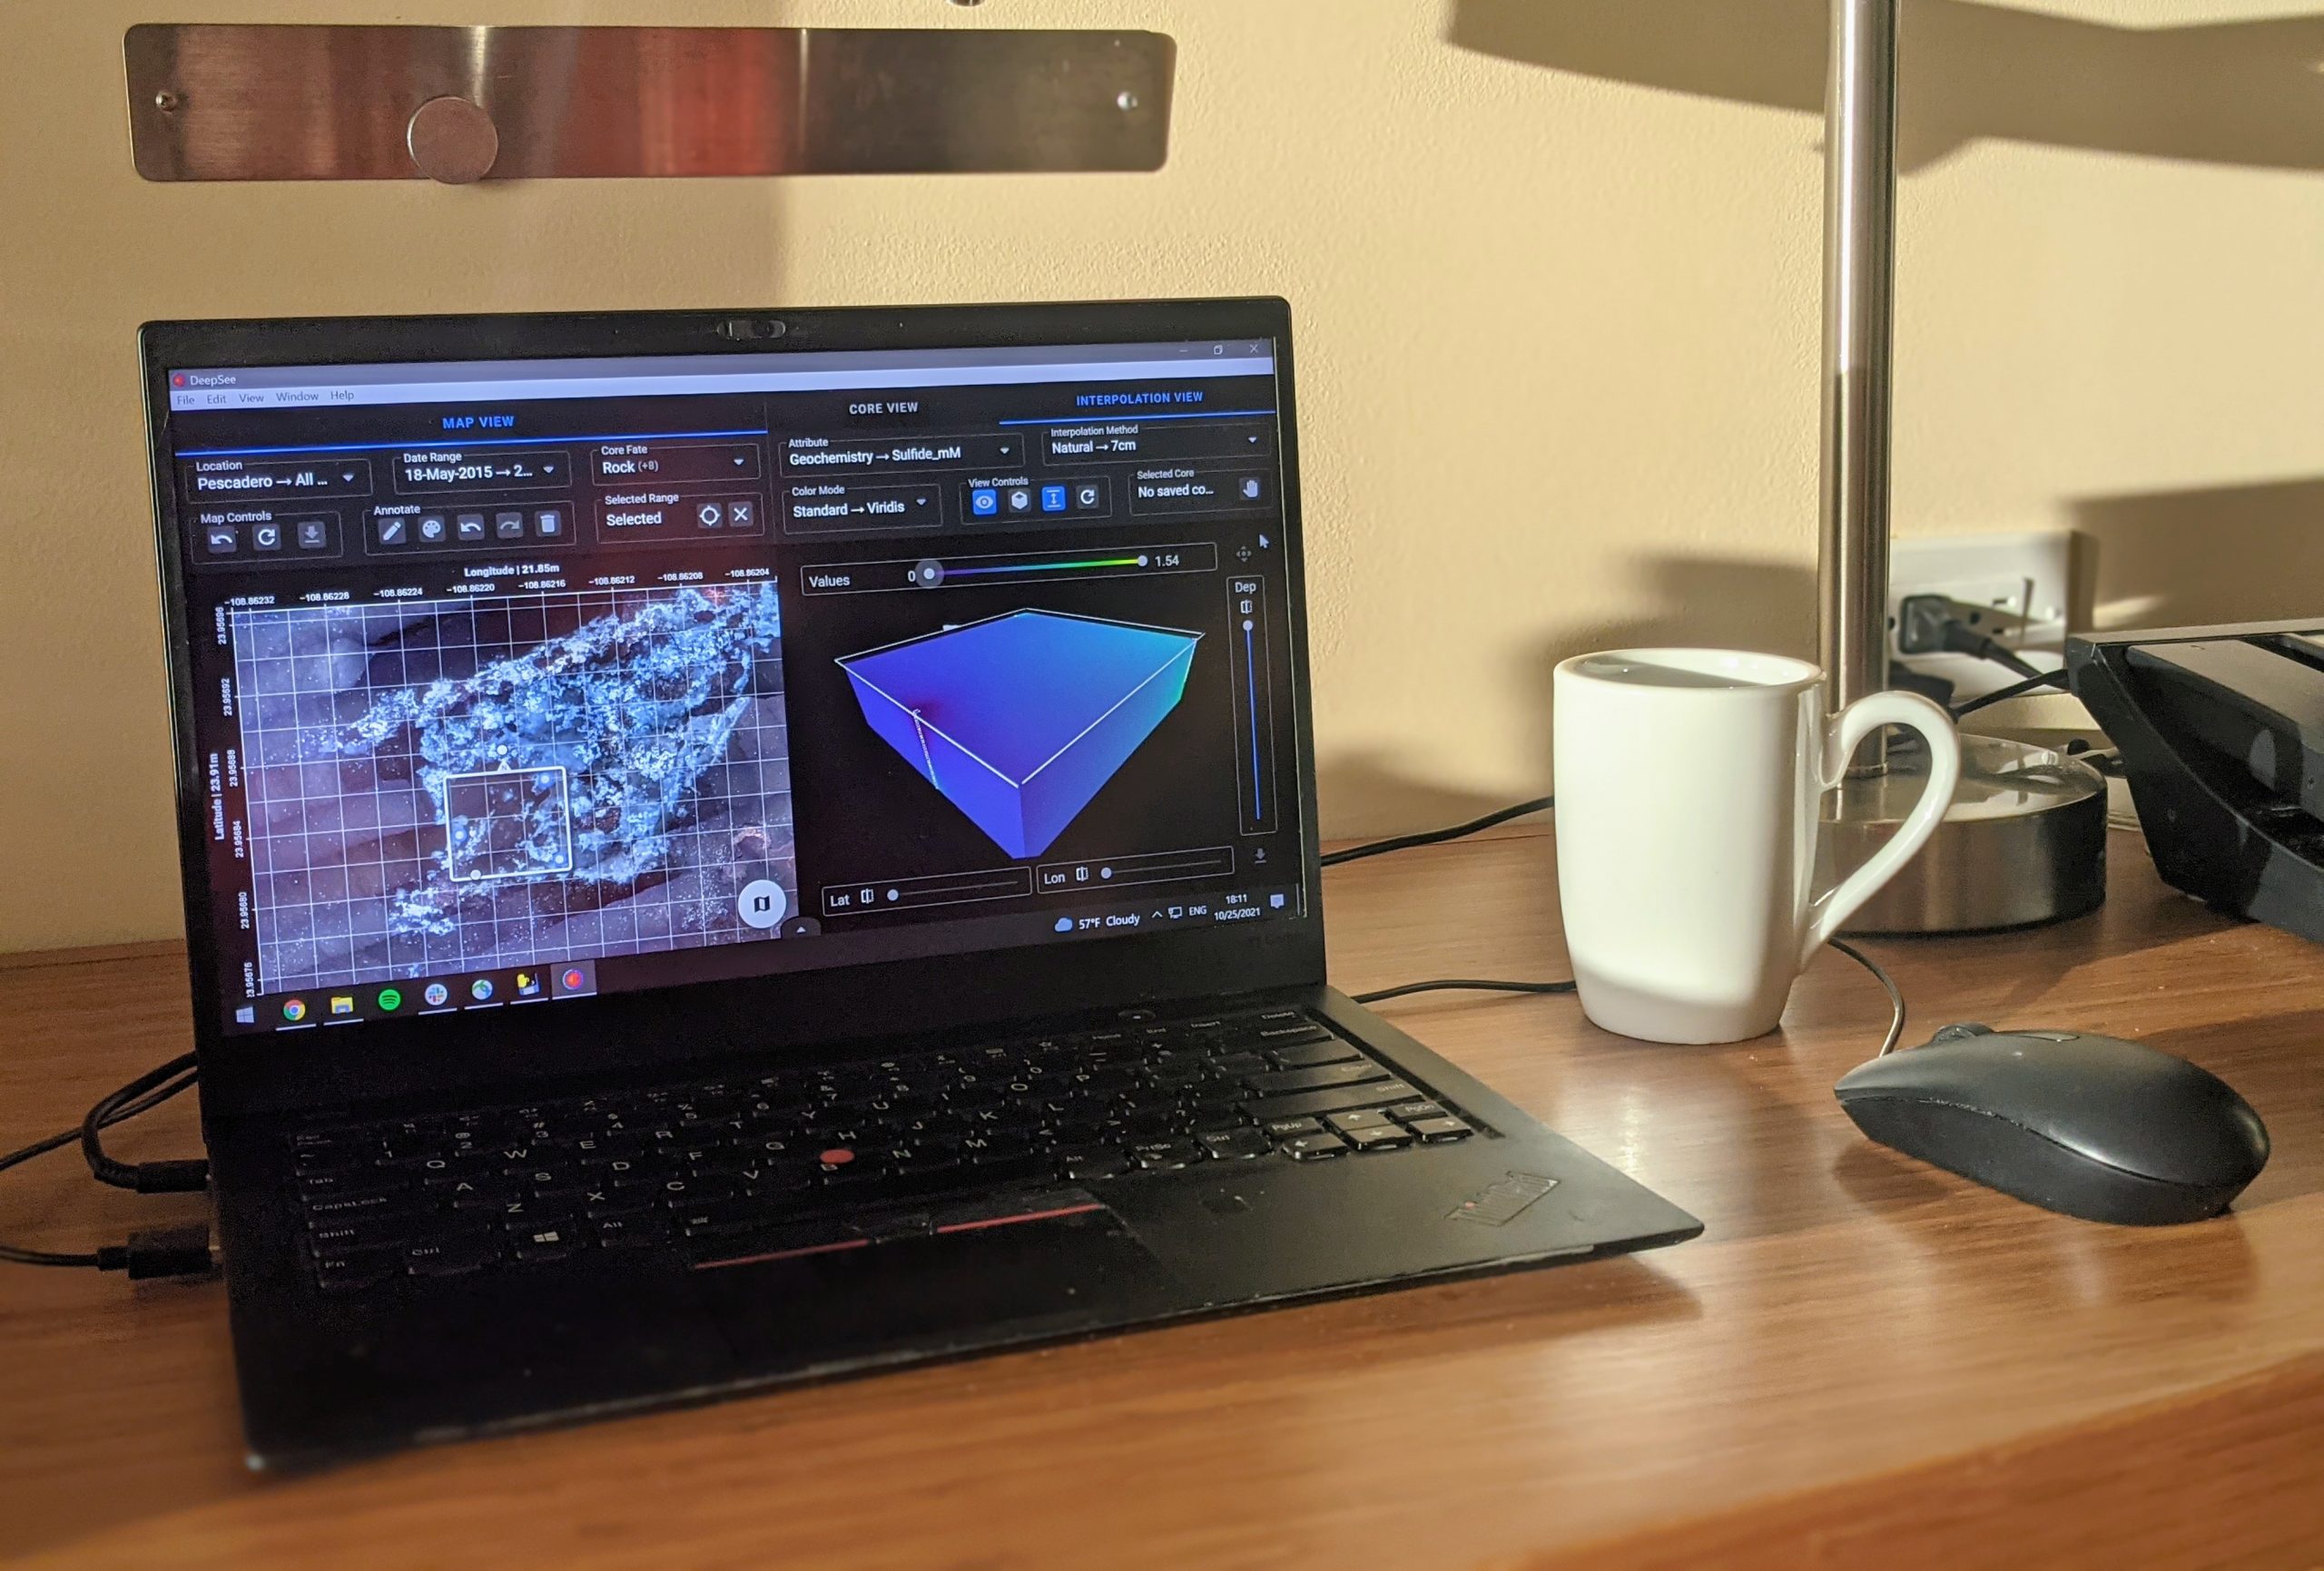
Similarly we, as marine scientists, will leverage a form of this functionality on our current expedition with DeepSEE: our own exploration tool to see everything we have collected and measured at dive sites in an intuitive and interactive way. Unlike seeing the Martian surface from space, however, we have to see through kilometers of opaque seawater. However, through the recent and dedicated efforts of Dave Caress’ mapping team and amazing advancements in autonomous and ROV mounted mapping tools and photo mosaics, we can paint a better picture of the seafloor than ever. Designed and architected in collaboration with the ‘Data to Discovery’ program at Caltech, DeepSEE thus leverages these novel data sets to grant us access to the ocean floor. Before DeepSEE, our work would entail pulling up a milieu of cruise log files, spreadsheets, and images and require hours of squinting at the numbers to decide which sites were ripe for a follow-up study on a future cruise. Naturally, this is even less conducive towards quick decision-making in the control room.
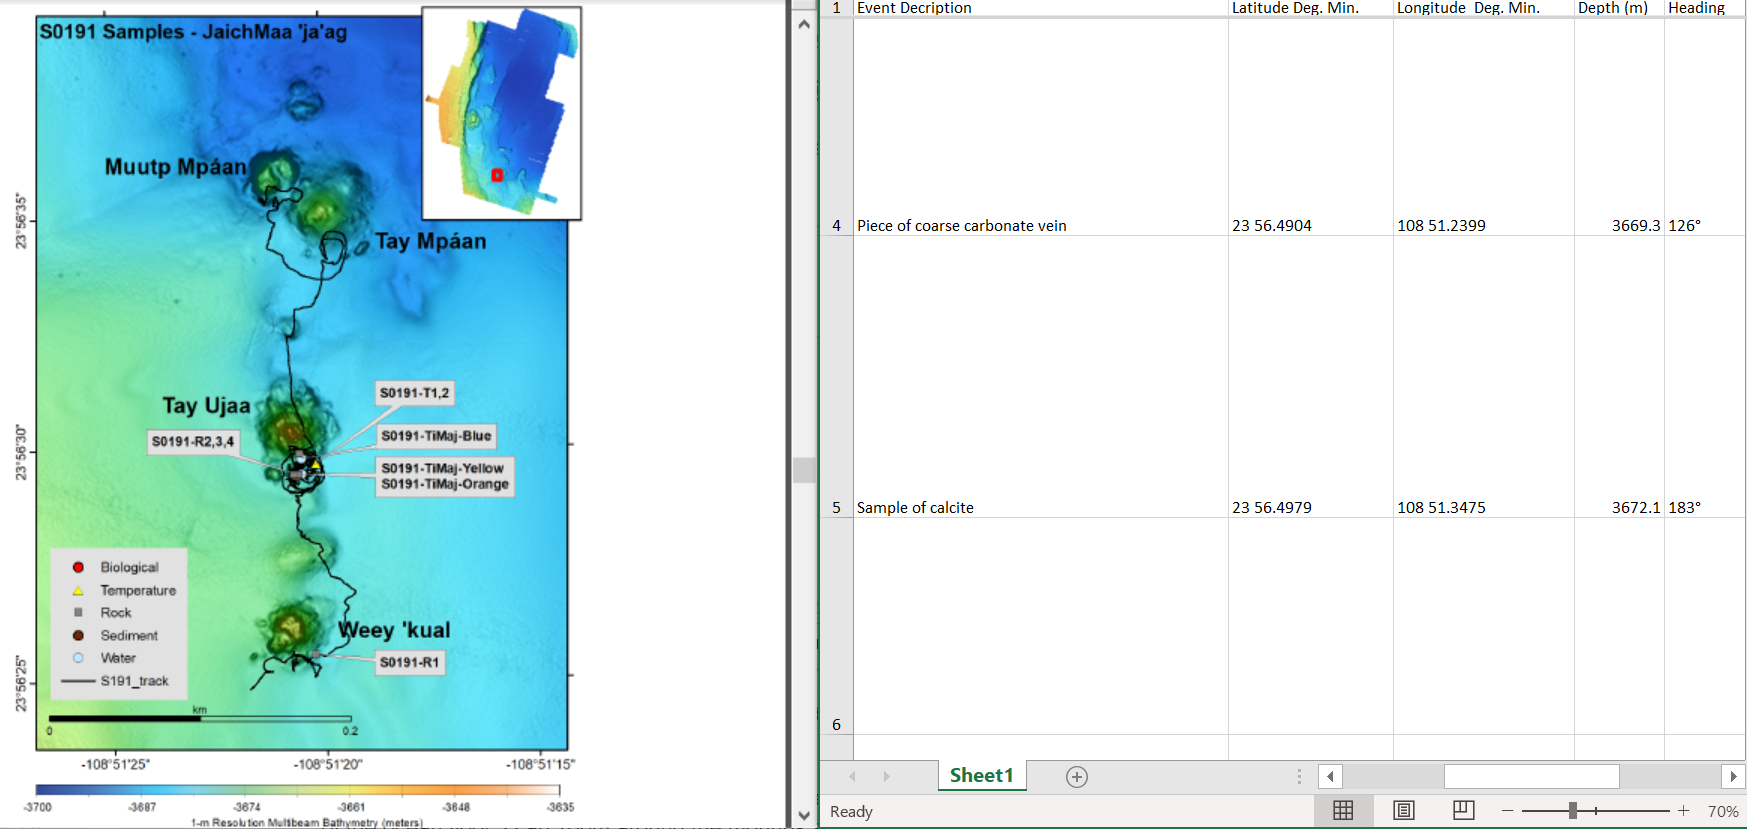
With DeepSEE and other tools like it, we can more quickly assess everything we know to make more informed sampling decisions. With a click, I can access past sonar and camera coverage of the ocean floor. I can zoom around the mounds and chimneys that indicate hydrothermal activity, where the critters and microbes we study live. With another click, I can see dots on those mounds – the history of samples taken by others on previous cruises. One click later, I can get a cross-section of each rock and sediment sample taken, with chemical concentrations, temperatures, and microbial inhabitants laid out in colorful, digestible figures. DeepSEE even features interpolative features – calculations that allow us to infer what the sediment could look like around the samples we have already collected and point us towards the most promising areas when it comes time to decide where to go and what to sample.
Tools like these are therefore vital towards maximizing the science we can do, and are doing, on our current expedition. The next time we see the Auka and JaichMaa ‘ja’ag vent fields in all their splendor on the screens of the ROV SuBastian’s control room, there will be another screen alongside it – our own virtual and interactive guide, assembled by the extended team of scientists who continue to work towards better understanding life at the ocean floor.
DeepSEE: Una Ventana Virtual bajo las Olas
En unos pocos clics, sin siquiera salir de nuestras oficinas, podemos estar a 3.660 metros bajo el agua, observando los animales y microbios que viven en los respiraderos hidrotermales del Golfo de California de una manera que ninguna inmersión con un ROV podría lograr. En esta expedición de investigación, el tipo de herramientas que nos permitió explorar la superficie de Marte se utilizará para avanzar en la ciencia de las profundidades, aquí en la Tierra.
Estudiar la vida en el fondo del océano no es una tarea sencilla, sólo porque es un mundo que sólo podemos experimentar a través de los ojos de los sumergibles durante un corto período de tiempo. En el momento en que el ROV SuBastian se sumerge bajo las olas, un reloj de 12 horas empieza a correr y los científicos, junto con los pilotos del rover, deben seleccionar cuidadosamente dónde ir y qué muestras tomar.
Así comienza un “triaje” científico que fusiona las observaciones y las decisiones tomadas en tiempo real con los objetivos y los planes de muestreo elaborados antes de que el barco zarpe. Esta es una tarea a menudo divertida, pero desalentadora. ¿Cómo sintetizar todo lo que se ha observado en el pasado y conciliarlo sobre el terreno con lo que muestran las cámaras del ROV? ¿Cómo podemos asegurarnos de que cada tapete bacteriano o muestra de roca es el mejor paso que podemos dar para responder a los misterios de la vida que se desarrolla ahí?
La exploración de la superficie marciana es un trabajo de búsqueda de caminos. Gracias al poder de la programación y el diseño, los científicos marcianos son capaces de combinar todos los datos que han recogido -imágenes de satélite, topografía, análisis minerales/químicos del rover- para formular un plan estratégico y visualizarlo en una herramienta informática que les permite ver el bosque a través de los árboles. Esta herramienta es la misma que se utiliza cuando llega la hora de la verdad, cuando la ventana “táctica” comienza y las comunicaciones por satélite sólo les dan 8 horas para trabajar con los conductores de los rovers para decidir dónde y qué van a muestrear.
Del mismo modo, nosotros, como científicos marinos, aprovecharemos una forma de esta funcionalidad en nuestra actual expedición con DeepSEE: nuestra propia herramienta de exploración para ver todo lo que hemos recogido y medido en los lugares de inmersión de forma intuitiva e interactiva. Sin embargo, a diferencia de ver la superficie marciana desde el espacio, tenemos que ver a través de kilómetros de agua de mar turbia. Sin embargo, gracias a los recientes y dedicados esfuerzos del equipo de cartografía de Dave Caress y a los increíbles avances en las herramientas de cartografía autónomas y montadas en ROV y en los mosaicos fotográficos, podemos pintar una mejor que nunca una imagen del fondo marino. Antes de DeepSEE, nuestro trabajo consistía en consultar un montón de archivos de registro de cruceros, hojas de cálculo e imágenes, y en pasar horas mirando los números para decidir qué lugares estaban listos para un estudio de seguimiento en un futuro crucero. Naturalmente, esto es aún menos propicio para una rápida toma de decisiones en la sala de control.
Con DeepSEE y otras herramientas similares, podemos evaluar más rápidamente todo lo que sabemos para tomar decisiones de muestreo más informadas. Con un clic, puedo acceder a la cobertura anterior de sonar y de cámara del fondo del océano. Puedo hacer zoom alrededor de los montículos y chimeneas que indican la actividad hidrotermal, donde viven las criaturas y los microbios que estudiamos. Con otro clic, puedo ver los puntos de esos montículos: el historial de las muestras tomadas por otros en cruceros anteriores. Un clic más tarde, puedo obtener una sección transversal de cada muestra de roca y sedimento tomada, con concentraciones químicas, temperaturas y habitantes microbianos expuestos en cifras coloridas y digeribles. DeepSEE cuenta incluso con funciones de interpolación, es decir, cálculos que nos permiten inferir el aspecto que podría tener el sedimento en torno a las muestras que ya hemos recogido y nos orientan hacia las zonas más prometedoras cuando llega el momento de decidir dónde ir y qué muestrear.
Herramientas como éstas son, por tanto, vitales para maximizar la ciencia que podemos hacer, y que estamos haciendo, en nuestra actual expedición. La próxima vez que veamos los campos de ventilación de Auka y JaichMaa ‘ja’ag en todo su esplendor en las pantallas de la sala de control del ROV SuBastian, habrá otra pantalla junto a ella: nuestra propia guía virtual e interactiva, montada por el amplio equipo de científicos que sigue trabajando para comprender mejor la vida en el fondo del océano.