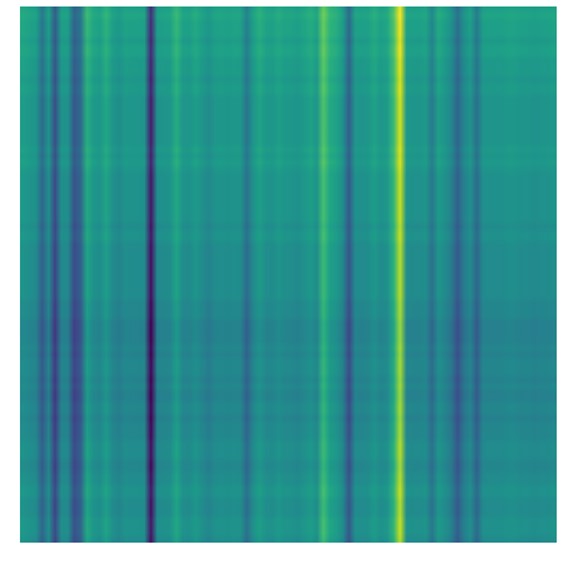
Now that the algorithms for the PLASM are set, programmer Gary Hendrick has begun to add the pH data. The first step in this process is to take a look at the data, the pH levels of ocean water collected with the Wendy Schmidt Ocean Health XPRIZE sensors off of Falkor. Lead Marine Technician Colleen Peters attributes some of the outliers in the data set to air bubbles in the seawater lines. To not skew the data, the outliers are filtered out and used along with temperature measurements to generate a matrix to seed the PLASM application. This is just one potential use of the filtered data, but, it’s pretty interesting visually.
The algorithm uses color to indicate pH variation. The image shown is the visual output from the data filtering and matrix processing, I will spare you the gory detail on the data smoothing statistics. The color image shown is NOT a graph of data, but a transformation of the data into a visual image or pattern. The colors selected are not arbitrary, they use the new Viridis color map.
Coloring data
Color maps are an important visualization tools because data doesn’t often make a lot of sense when you just look at it. By mapping values to corresponding color you can see the structure of the data. Color maps are the interface between data and your brain. Unfortunately, not all color maps are created equal and can sometimes misrepresent the data. Since you can assign colors, small changes in the data sometimes produce large perceptual differences such as going from green to red and vice-versa. That is why consideration for lightness gradient is important.
The color map applied to the PLASM program is designed in such a way that it will be analytically and perceptually uniform, both in color and in black-and-white. It is also designed to be perceived by readers with the most common form of color blindness (which is why there are no red colors used).
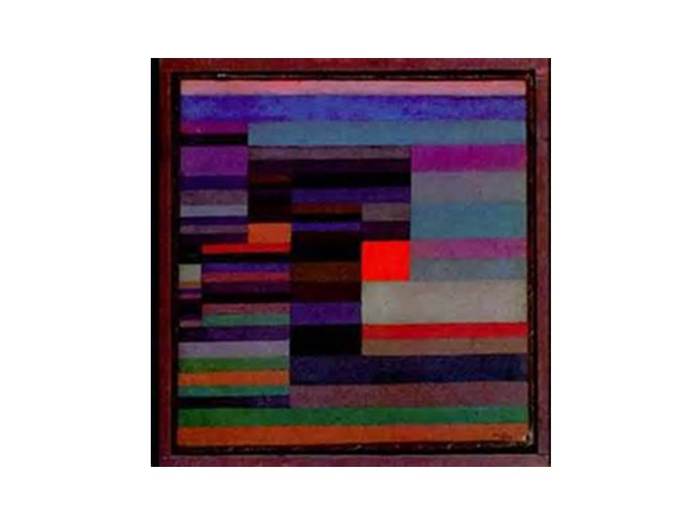
Data or art?
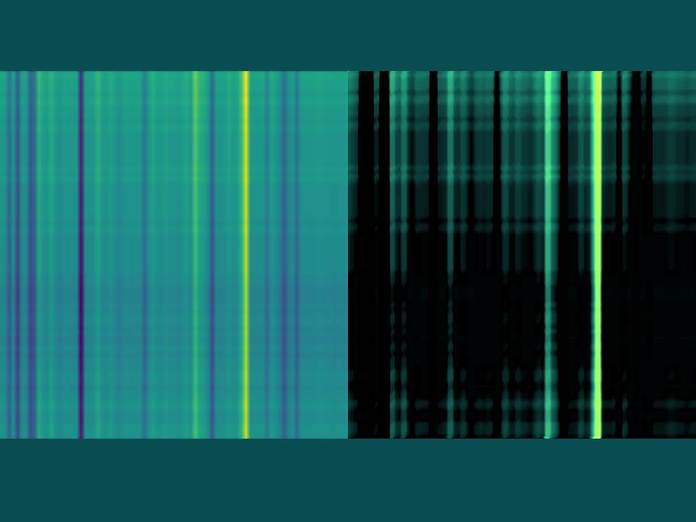
Above you can see some of the pH data that has been modified using a further bitmap distortion function (right side). This image reminds me of the famous painting Fire in the Evening by Paul Klee. The red opaque rectangle and bands of browns, greens, violets, and blues dynamically interact to suggest built structures or geographic formations.Fire in the Evening was created during a trip to Egypt in the winter of 1928–29 and inspired by a number of striated compositions in nature. Similar to the art being produced here, the art carries a lot of structure.
For now, we will carry on processing the data and seeing what kind of visual structure will be revealed with the data collected on the transit from Guam to Honolulu. Stay tuned as we continue to program in the name of art.