To me, data make up stories, which are then told through math.
Data Stories
Data can be a bit difficult to read, even if you are an expert. In my artistic practice, I use art to make data more decipherable – and hopefully more inviting – to a wider audience. Art makes this possible by opening up the information, turning the data into a story, and giving people an appealing entry point to explore the data.
I have set sail on the R/V Falkor in transit from Manzanillo, Mexico to Portland, Oregon. One of the goals I have on the ship is to tell some of the stories of the ship’s data. Being on the ship has also given me a crucial opportunity to brainstorm with scientists, engineers, and the two other artists aboard about ways we can humanize data in general.
Nautical Cartography – Now and Then
The R/V Falkor’s crew taught me about the marine cartographers of old drawing maps by hand and candlelight and sounding the depths of the ocean with leadlines in fathoms. I wish my hands were that steady to accurately draw maps and that we had the kind of time it takes to map the ocean like that.
Fortunately for me, this is the new era I have a robot I built to draw data for me, and the ship has multibeam mapping to visualize the seafloor, which I have been sketching. One goal is for the ship to map and name a seamount in international waters off the North American coast. One of the data stories I want to share from this trip is how exciting it is to find something new and discover the unknown.
The Robot
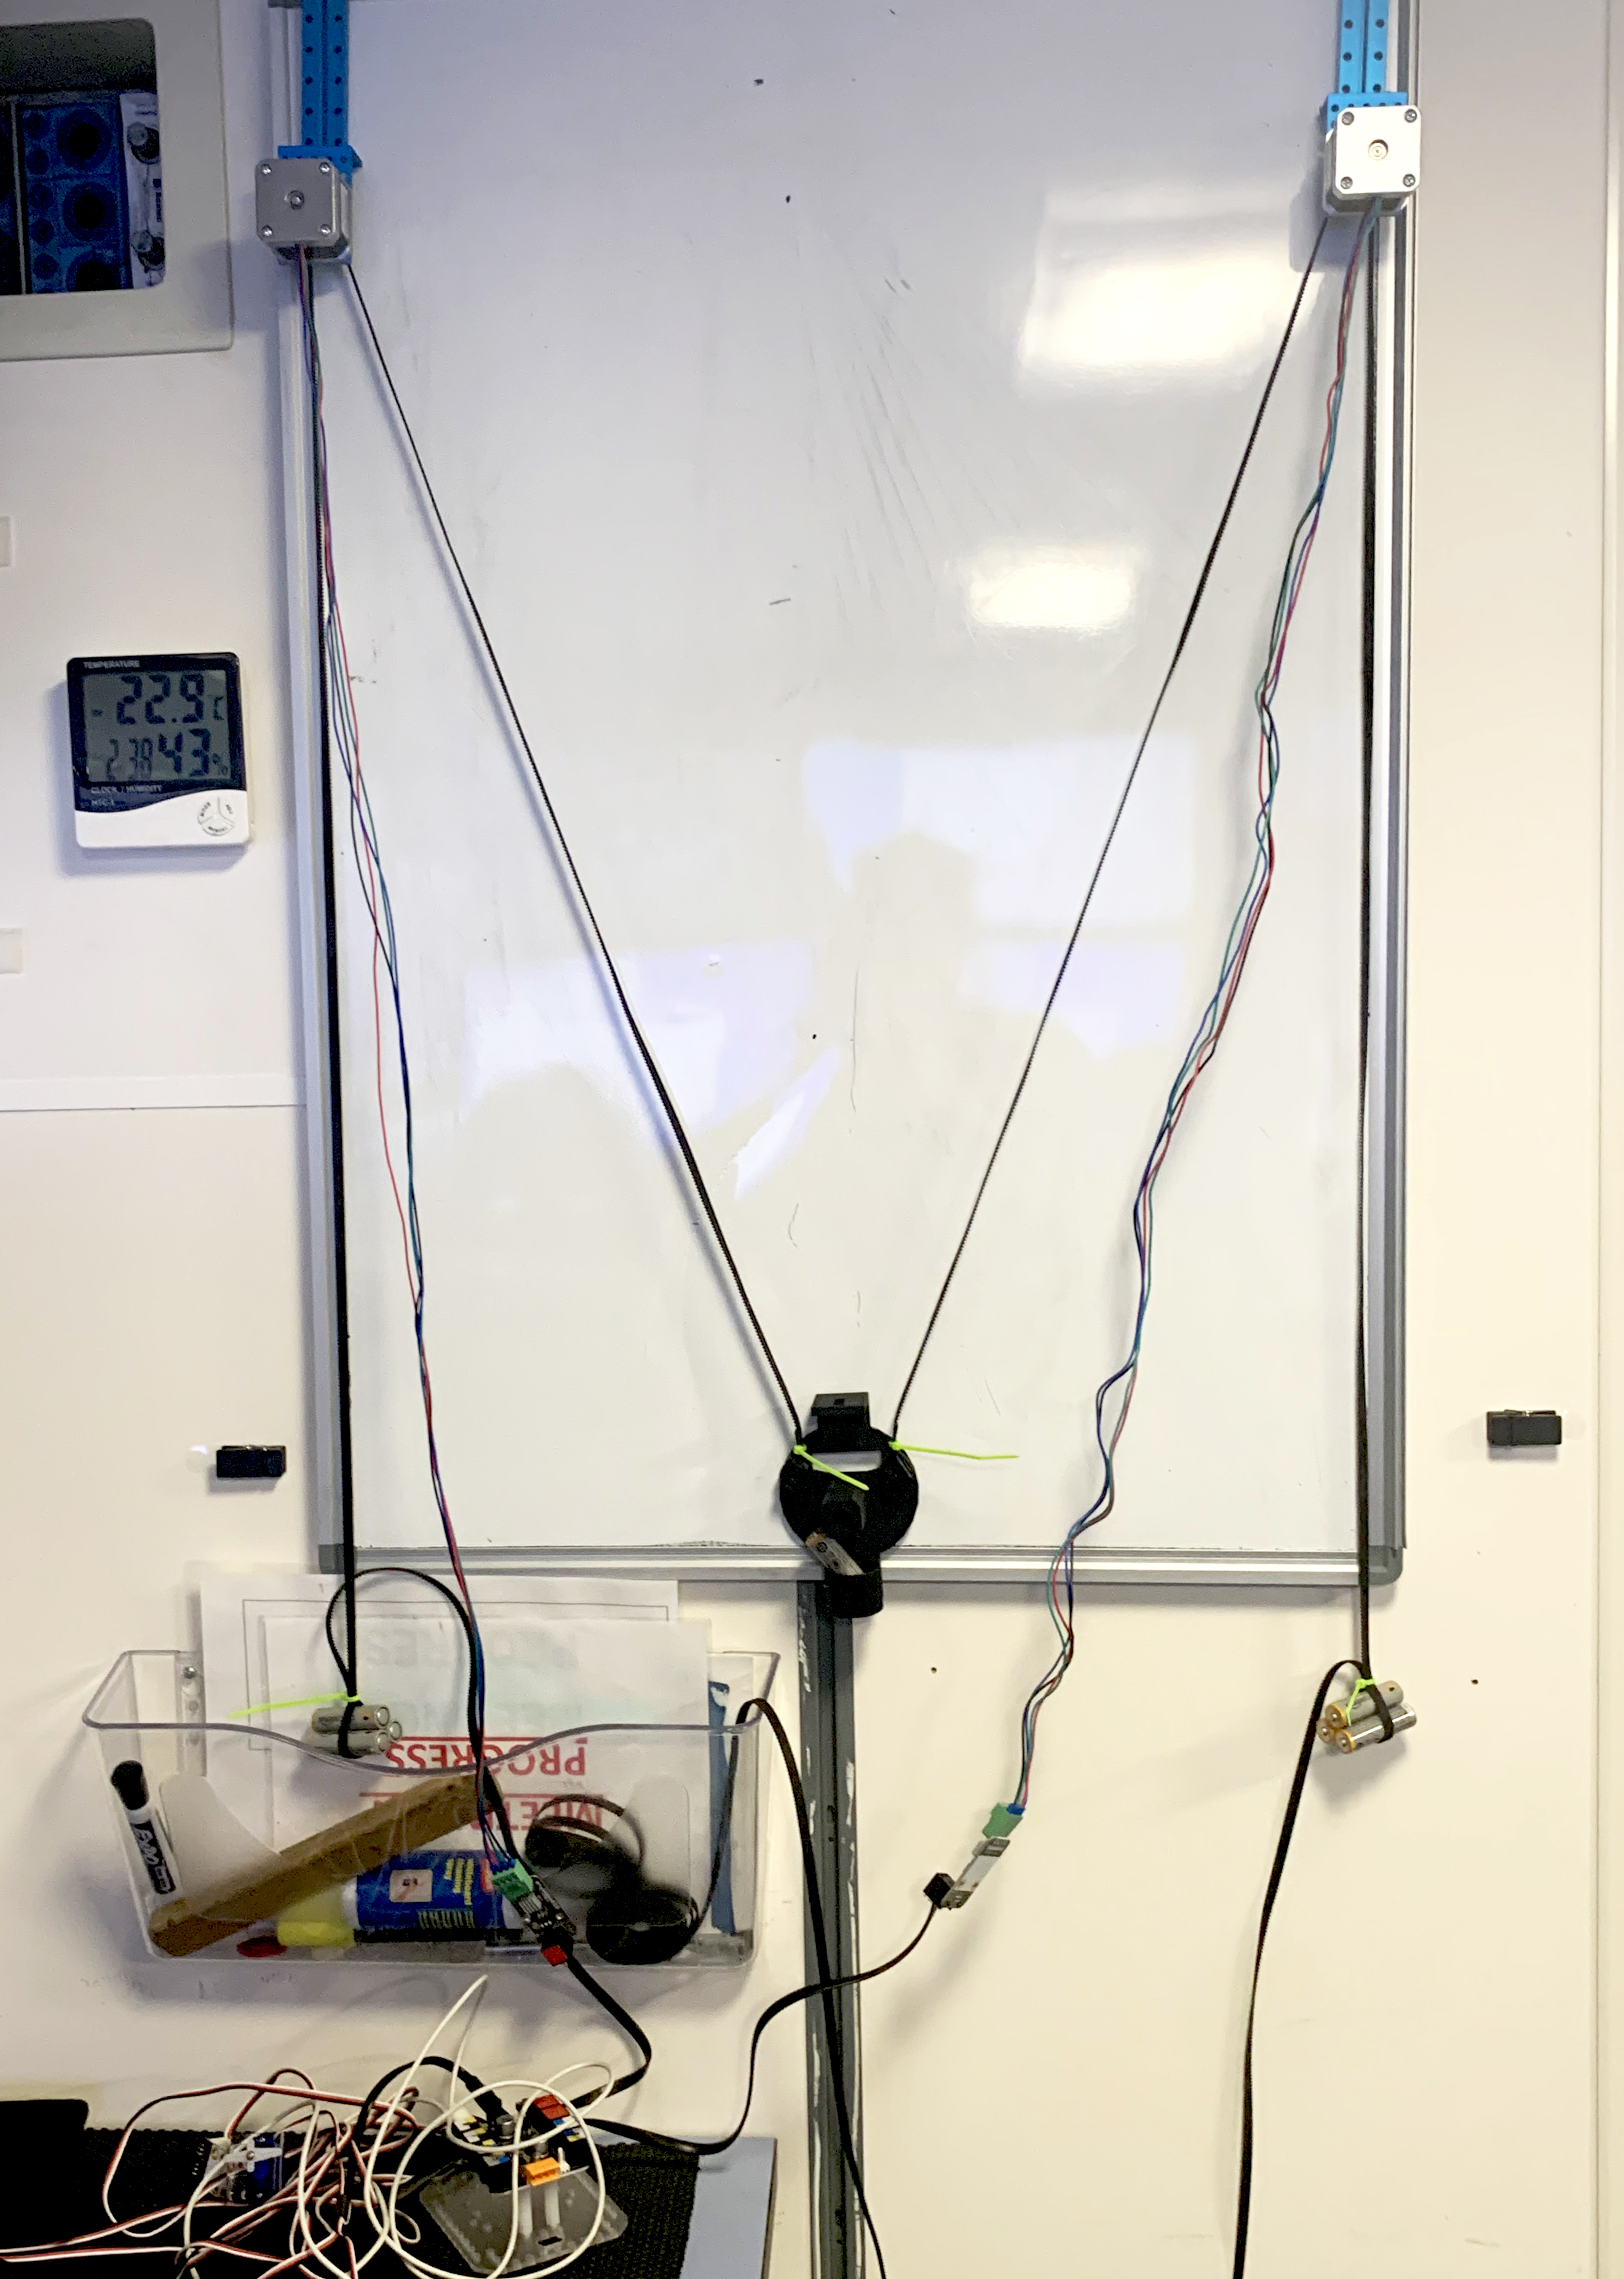
So far, I have had an amazing time so far on R/V Falkor. Setting up the robot I am working with has gone really well (which is an anomaly for me). The robot is a polar drawbot. It draws by plotting XY coordinates with a pen, as two motors move a chassis from point to point along a flat surface. I was delighted to put it in the control room which is the hub of data and had the flattest wall space.
I will get access to the ship’s data when we leave Mexico’s Exclusive Economic Zone (EEZ) and enter international waters. I am excited to work with the multibeam mapping data exports of seamounts, hydrophone (underwater microphone) data of whales and submarines, bubble plumes, and some of the real-time data coming off the ship. I am struck by just how much data there are aboard. When I ask for something, I am made aware that I can have all these other interesting data to make art with. One of my greatest challenges here will be narrowing down data to work with.
I feel incredibly lucky this week. In my next post, I will post some of the work the robot it is doing.