The El Niño/Southern Oscillation (ENSO) is a phenomenon within the coupled ocean-atmosphere system in the equatorial region of the Pacific Ocean. ENSO is comprised of interannual climate oscillations, a warming period known as El Niño and a cooling period known as La Niña. Occurring every 3-5 years and lasting 9-12 months, El Niño has a dramatic impact on global climate affecting temperature, precipitation, food supply, and economies (NOAA National Weather Service).
El Niño conditions have been documented as far back as 1726, and due to global implications, ENSO has been studied and modeled extensively. There are many variables within the complex ocean-atmosphere system leading to El Niño conditions. Aboard the R/V Falkor, Dr. Kelvin Richards heads a science crew that will take a closer look at these variables. We are currently experiencing El Niño conditions—auspicious circumstances for an equatorial cruise, collecting data on important underlying processes of El Niño.
The “norm”
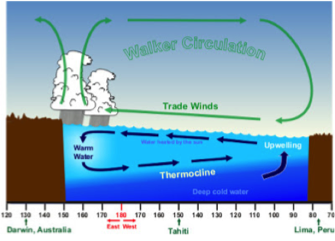
All weather patterns are variable and changing, making it difficult to classify any weather pattern as “normal”. However, the Pacific Ocean has a “ground zero” to which it tends to return to. Typical conditions include warmer water in the Western Equatorial Pacific and colder water in the Eastern Equatorial Pacific.
Warm surface water in the west evaporates and heats the air as it rises, creating a low-pressure system. Conversely, cold water in the east increases atmospheric density; sinking the air and creating a high-pressure system. In response, trade winds form flowing from high to low pressure, i.e., from the east to the west.
Such trade wind action transports warm surface water to the west, causing strong coastal upwelling of cold, nutrient-rich waters off the coast of South America. The relative high and low-pressure zones in the Pacific dictate the strength and direction of the trade winds, and thus, inform the stages of the ENSO sequence.
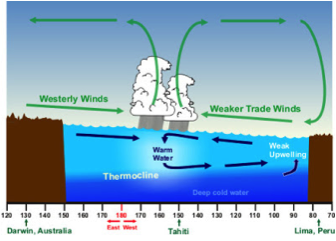
El Niño
Climatologists are not in unanimous agreement on what triggers an El Niño event. Some assert that it is the natural frequency of oscillation in the Pacific Ocean’s atmosphere’s, while others favor the idea that the ocean has a tendency toward redistributing heat, and then there is the small few who hold hope for an unknown forcing mechanism as the cause of El Niño conditions.
Whatever the catalyst, when El Niño is triggered, Easterly trade winds weaken and less upwelling occurs. In a full swing El Niño, warm surface water migrates undeflected eastward, due to the lack of Coriolis effect along the equator. This establishes a steep pycnocline—a density gradient that prevents vertical mixing and further inhibits upwelling.
The resulting impacts of El Niño are felt worldwide including widespread droughts, floods, and decimated fisheries. South American equatorial regions are hit especially hard due to decreased upwelling. This causes the marine food web to collapse from lack of nutrients, resulting in massive disruptions to crucial ecosystems off Peru (Segar, 2007).
The turbulence of mixing and modeling

During the Mixing up the Tropical Pacific cruise, Dr. Kelvin Richards and his science team will employ a lowered Acoustic Doppler Current Profiler (ADCP) and a Vertical Microstructure Profiler (VMP) to measure actual mixing in the equatorial regions during El Niño conditions. By accurately representing the processes that create “real mixing,” scientists can incorporate a realistic mixing component into calculations to increase the reliability of ENSO models.
Mixing is an essential part of the variable dynamics relevant to the ENSO system. One process that produces mixing is turbulence, represented by turbulent energy dissipation rate, “ε” (epsilon from fluid dynamics equations). We can measure this dissipation rate and use it in oceanographic models.
 For simplicity, let’s use an analogy to understand the difference between mixing and turbulence; a free spinning top represents turbulence, and a key in a lock represents mixing. We can continue spinning the top continuously, i.e., turbulence can potentially go on and on as long as you add energy, but we can only turn the key until the door is unlocked, i.e., once mixing is complete, you cannot mix it any more.
The incorporation of mixing into model equations is a bit tricky. The small-scale mixing that we will measure is not a direct input for oceanographic models. The problem, as International Pacific Research Center Post-Doctorate Dr. Saulo Soares puts it, is that powerful enough computers to “solve the small scale mixing in the entire Pacific Ocean” simply don’t yet exist. These measurements must be parameterized in order to be useful in models. This is a fancy way of saying that we overcome technological limitations by utilizing measured data to produce a function that estimates turbulence.
Existing models are unable to resolve ε (turbulent energy dissipation rate), but they can compute an estimate using parameterization of measureable variables such as temperature (T), salinity (S), and horizontal currents (u,v). For oceanographic models, we don’t care so much about the turbulence; as we do about the mixing. Kz is the equation for mixing and can be characterized by “eddy” diffusivity, Kz.
Kz = ƒ(ε,N2)
As you can see, the equation also contains ε (turbulent energy dissipation rate), and N2, which describes density differences between adjacent layers. These two terms work against each other in controlling mixing. Larger N inhibits mixing, while larger ε enhances mixing. Not all that long ago, Kz (mixing) was merely a best guess constant in models, but is now calculable. Advances in scientific technology have allowed us to develop predictive models with increasing accuracy, contributing to the understanding of El Niño, but we still have much to discover. Questions like what is generating the turbulence, and how much mixing does the turbulence produce, are still waiting to be solved.