If you’ve been paying any attention at all to the news in the last, say, two decades, you will know that the temperature of the ocean is increasing. Many national and international agencies and non-profit organizations have devoted funding to study these phenomena and they all point to the same answer – Earth’s ocean is getting warmer. Understanding how the ocean absorbs and distributes excess heat trapped in the atmosphere is critically important to understanding how this warming will affect climate and overall weather patterns on Earth.
But temperature measurements of the ocean can also tell us so much more. For example, the NSF-funded projects T-Tide and T-Beam are using ocean temperature to better understand regional scale movements of different water masses in the ocean. As described in previous blogs, water temperature can indicate the location of the passing internal tide as it lifts deep colder water up closer to the surface. Temperature also helps scientists track eddies that may interact with the internal tide. It is also an indicator of larger ocean currents and gyres. So to tease out the internal tide “signal” within this region of the Tasman Sea, the science team is collecting LOTS of temperature data. Here’s a description of the various tools these teams are using to study temperature throughout the water column.
Big Rosie
The CTD (Conductivity, Temperature and Depth) instrument on the large rosette, whom I’ve nicknamed “Big Rosie” (just now) measures water temperature at a frequency of 16 Hz, which is 16 times per second. Since Big Rosie moves up and down in the water column at around 60m/minute (1m/sec), this would yield about 16 temperature measurements per meter. This seems like a lot, but in order to provide an accurate picture, the computer programs that visualize the data need to average many measurements for each point on a graph. Since the internal tide generates smaller internal waves of higher frequency, an instrument that samples even more frequently, if available, would give us an even better understanding of the wave profile.
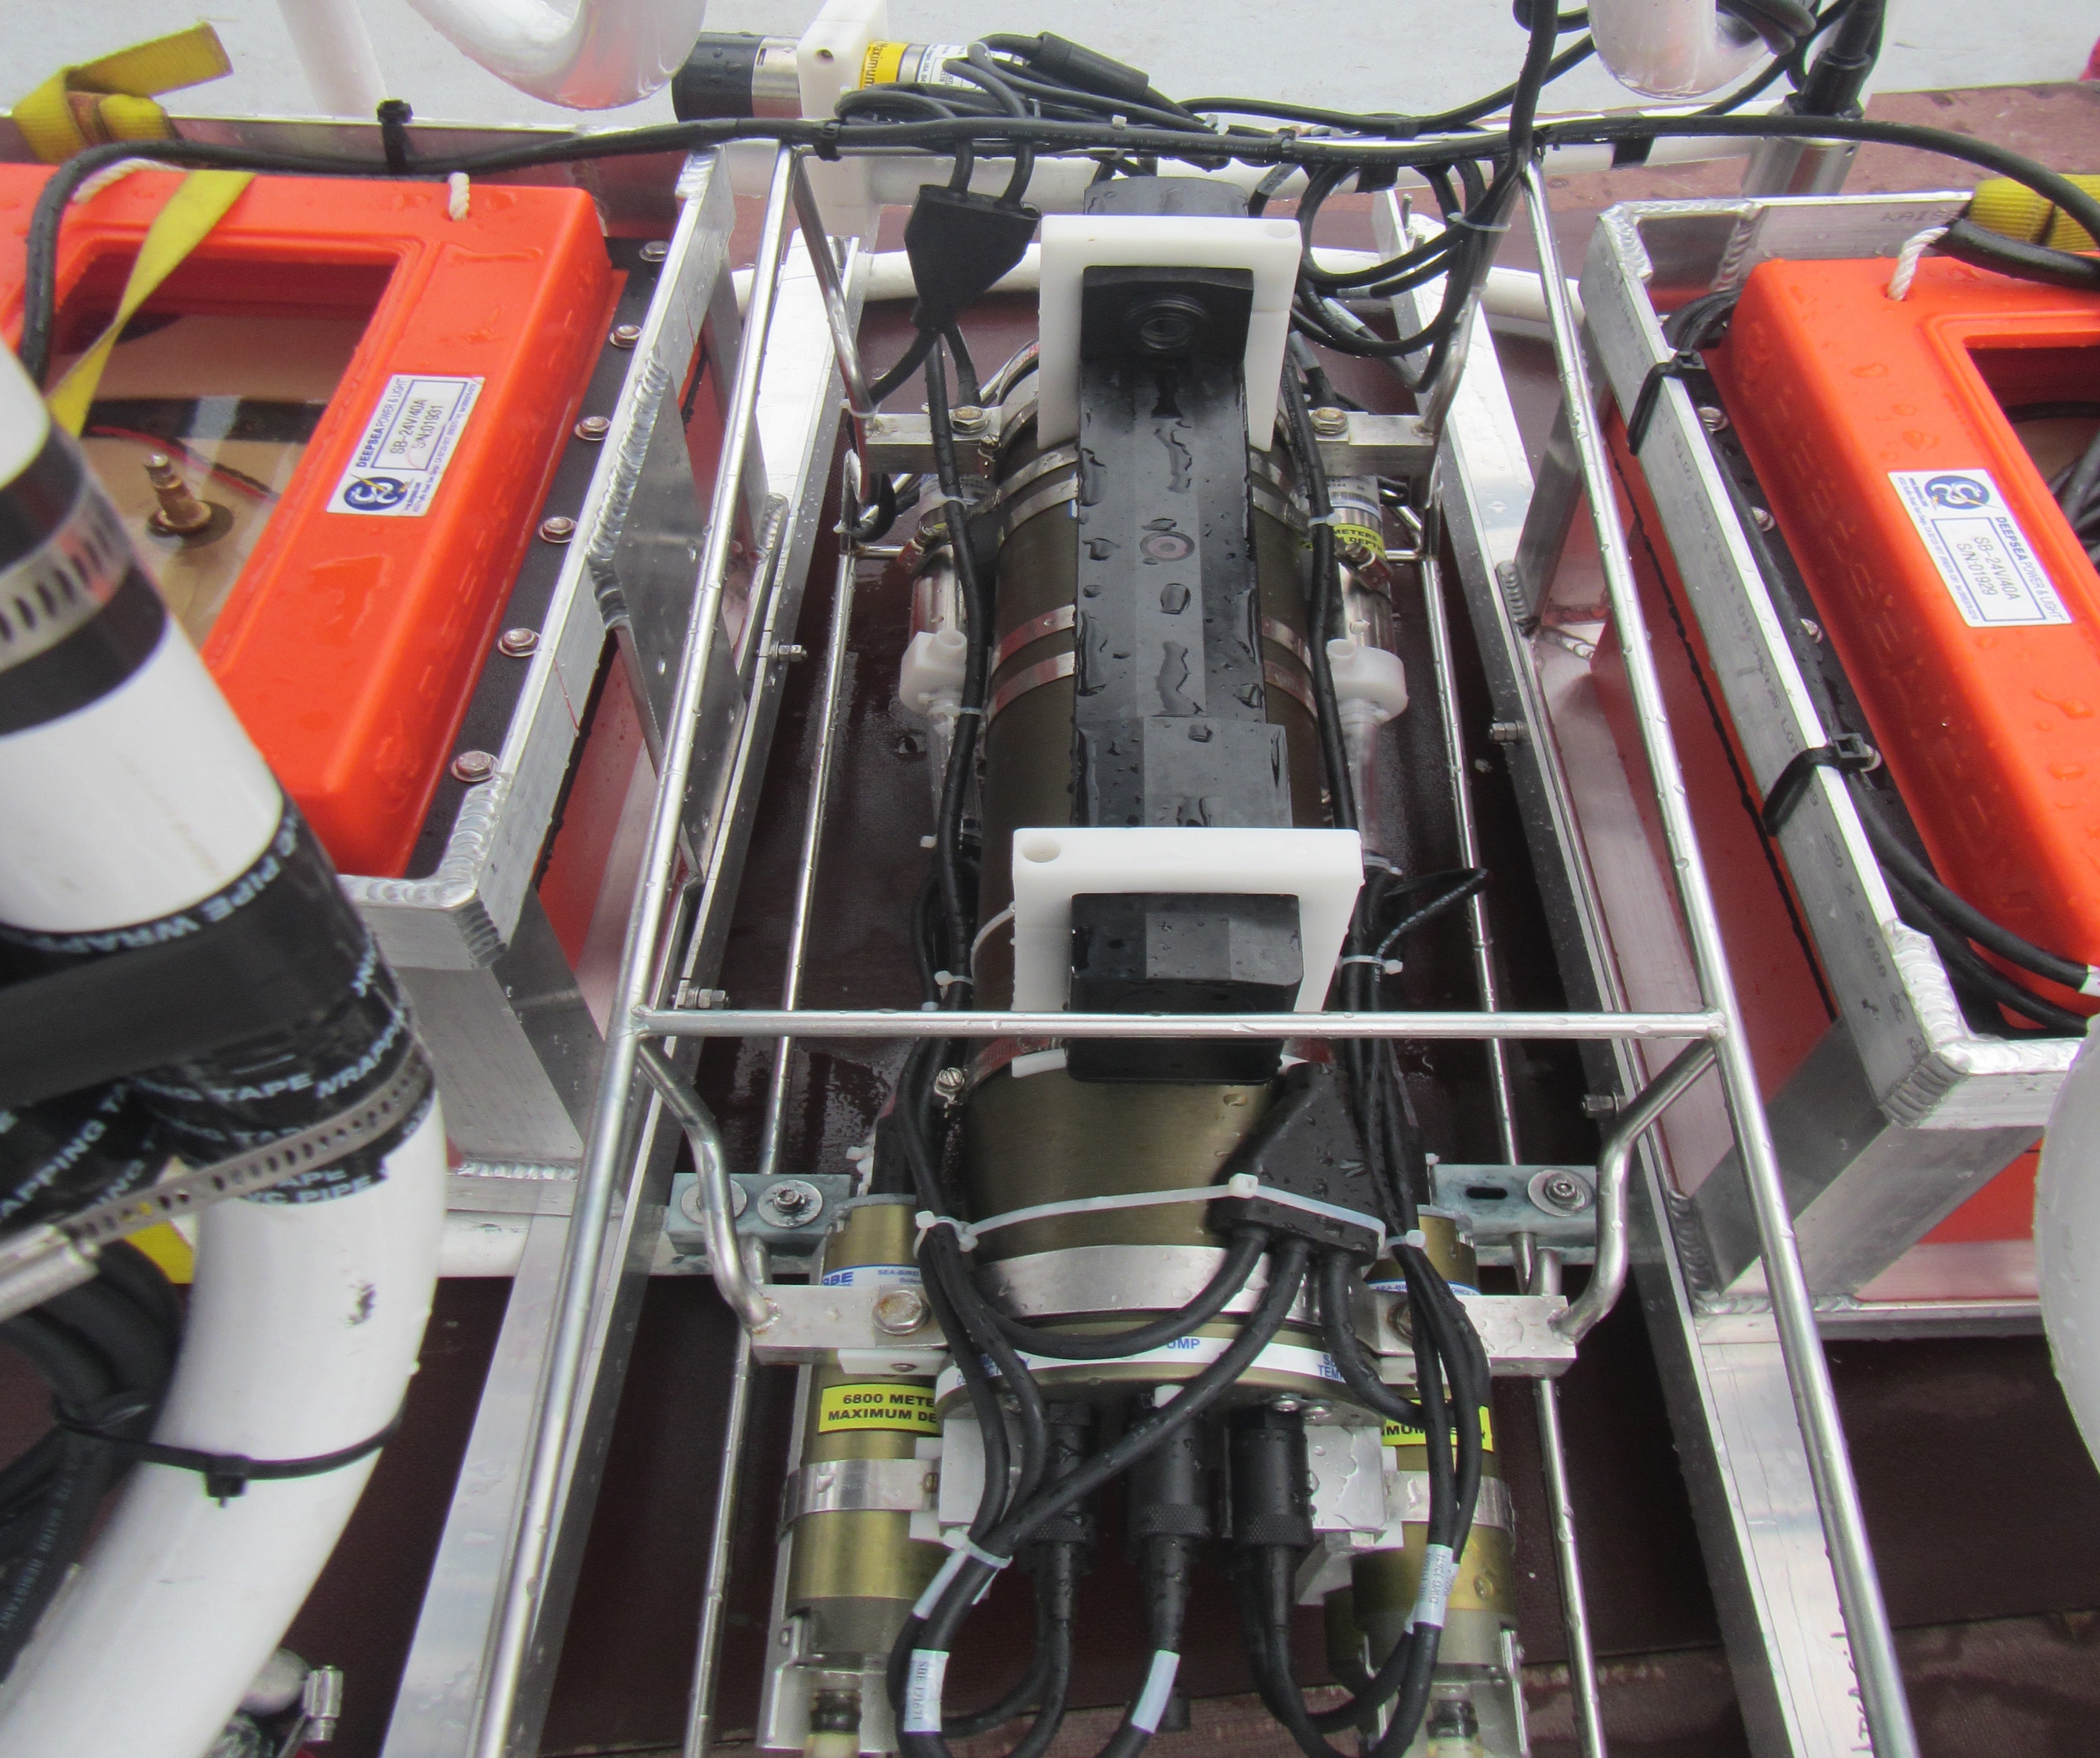 Big Rosie – the CTD instrument mounted on the large rosette. The orange boxes are the batteries for the ADCPs.
Chi-pods
These don’t need a nickname because their real name is already cool. Chi-pods were developed fairly recently at the Ocean Mixing Group at Oregon State University and can take temperature measurements at 100Hz (100 times per second). They are also mounted on the large CTD rosette, and therefore provide information on the full depth of the water column. This is clearly an advantage for studying smaller scale processes. But because of this, as with Big Rosie, they only sample any given depth of the water column every couple of hours because it takes this long for the rosette to be lowered to the bottom (to 4500m deep) and come up again. Another thing about these little instruments is that their sensors are, well, sensitive, and so can be damaged by anything bumping or brushing up against them. Fortunately, there are many replacements on board, just in case.
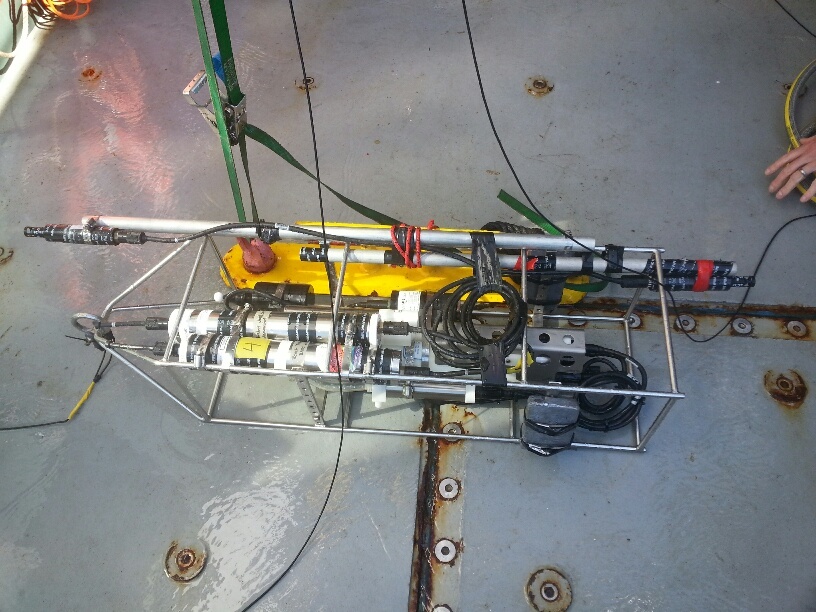 Lil’ C(TD) with two Chi-pods attached.
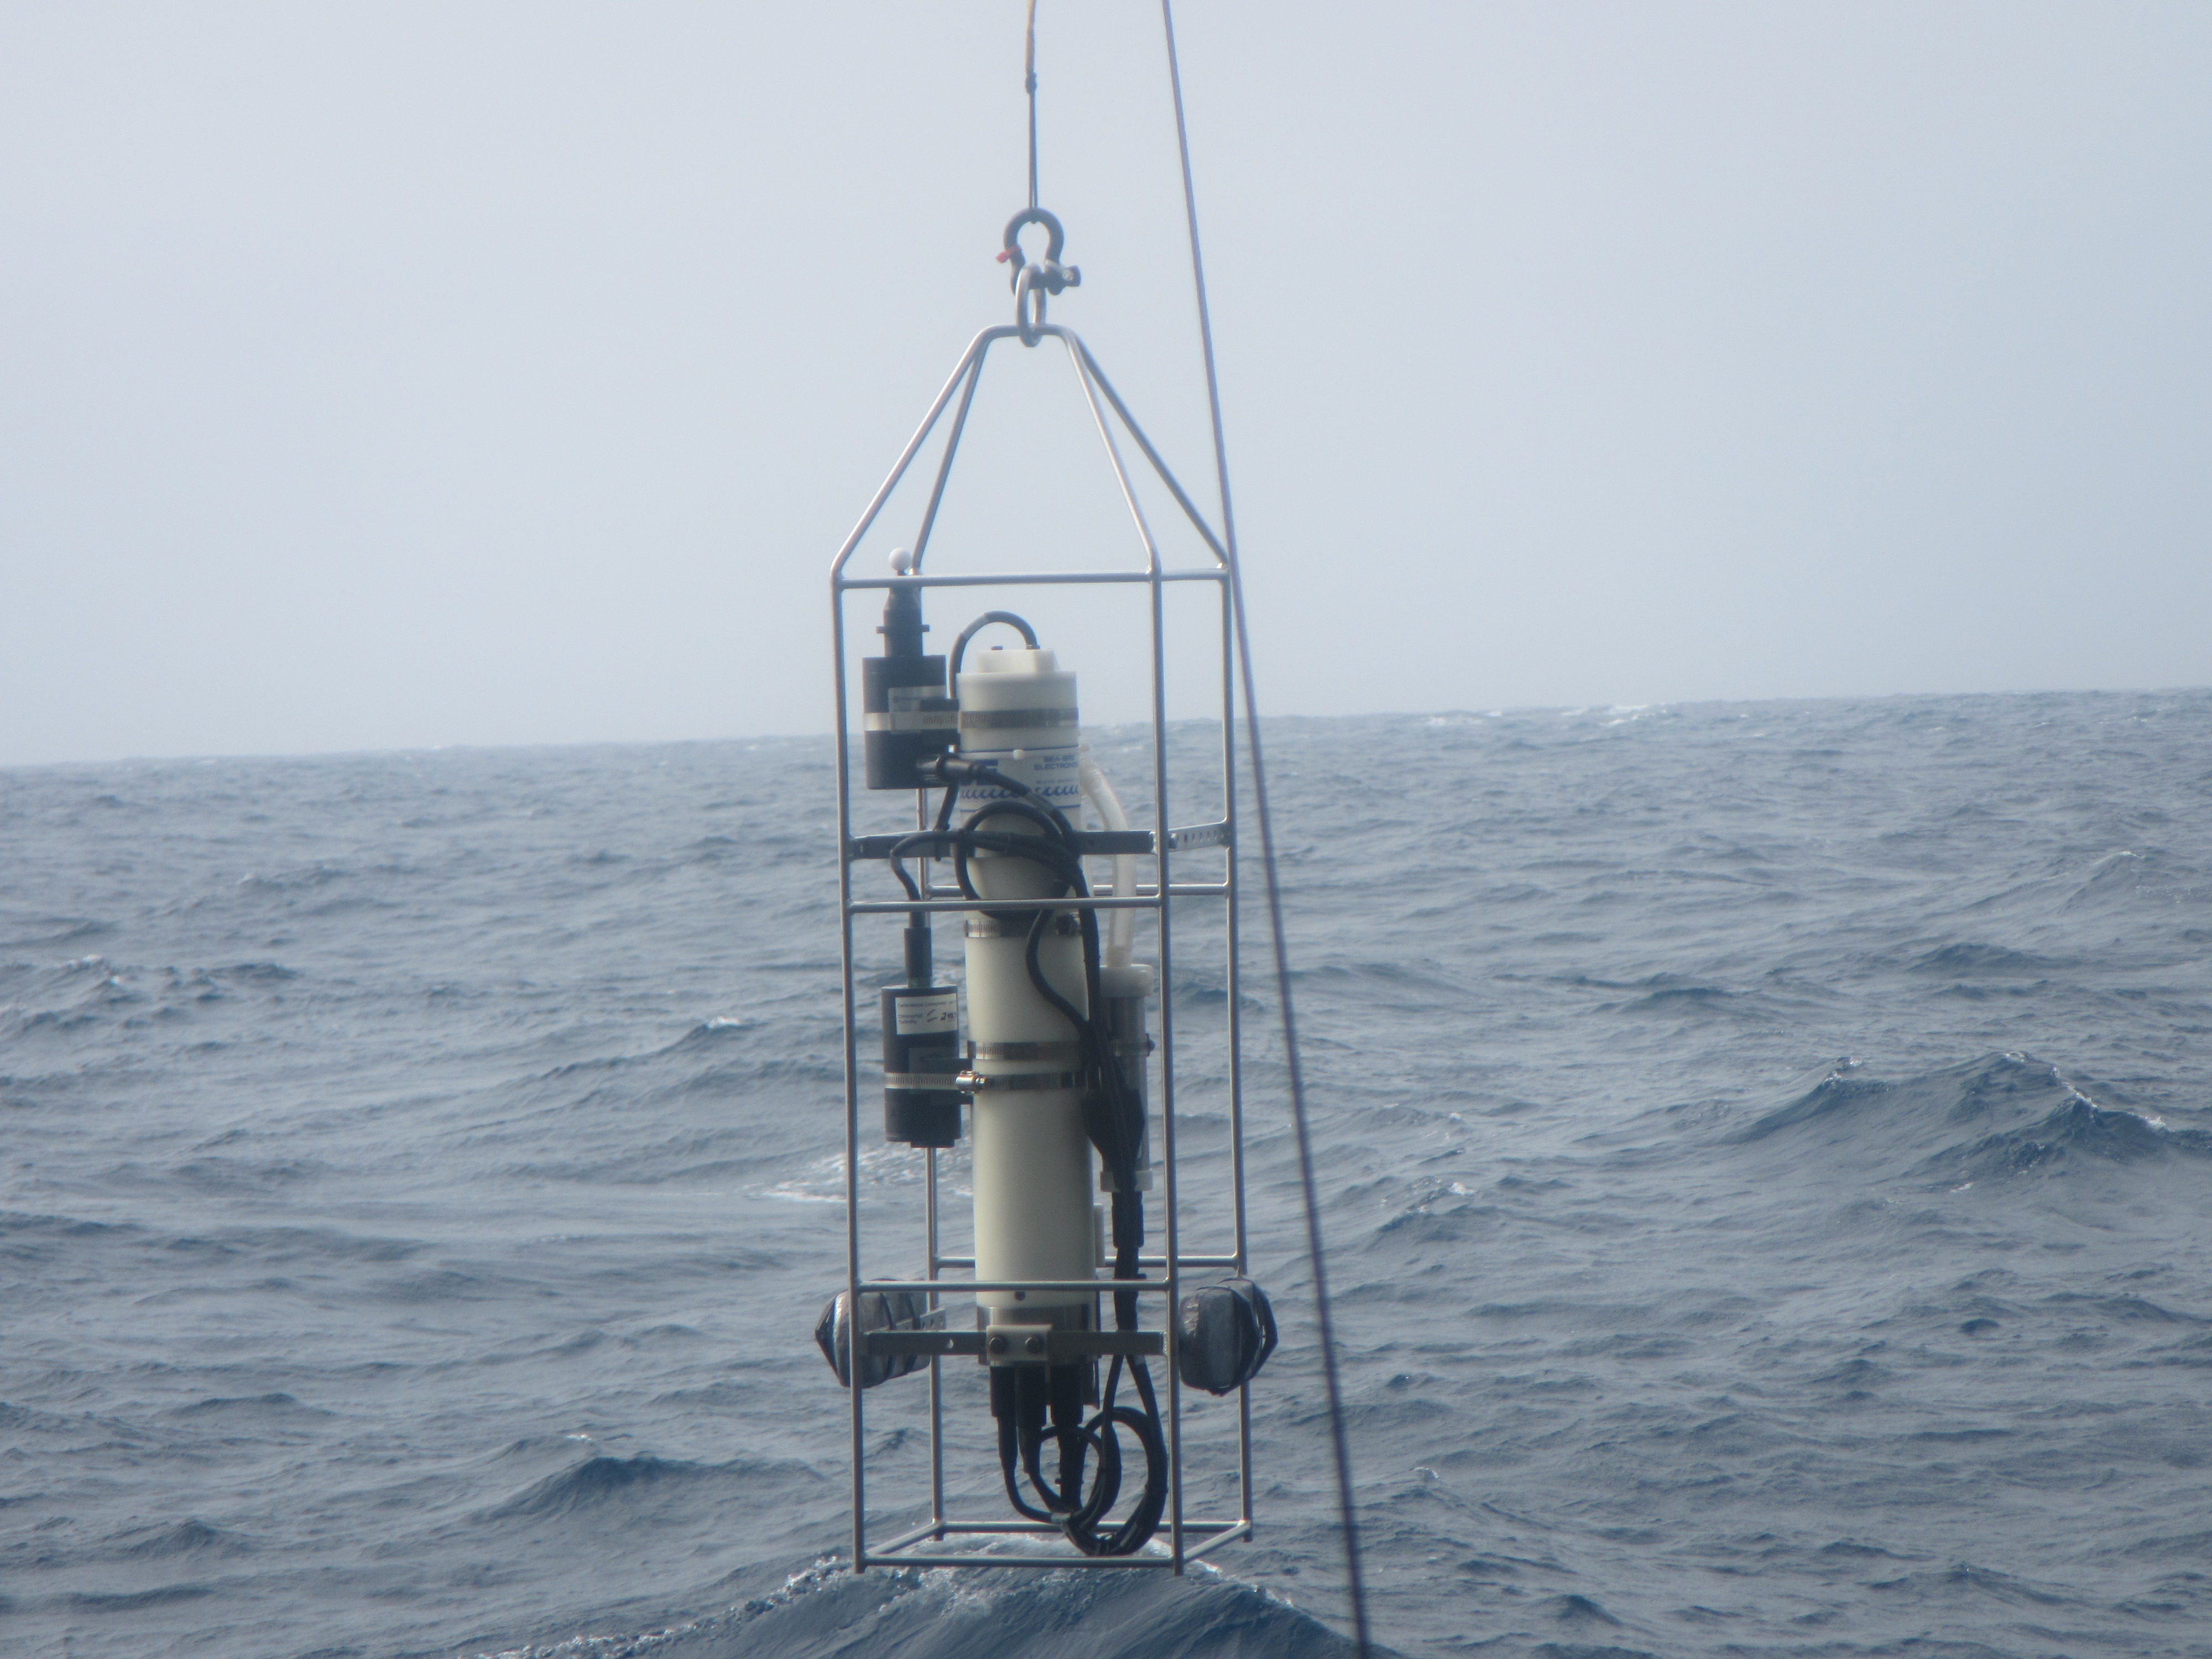
Lil’ C(TD)
As mentioned previously, the team is also using a smaller CTD unit, which I’ve just dubbed, “Lil’ C(TD)”. This instrument is mounted in its own cage and is being deployed every 1-2 hours to just 180m depth. Due to its weight, and the roughness of the seas here, the large CTD is being used to profile the water column below 200m depth. Lil’ C(TD) is giving the team critical information about the water profile at the surface, where much of the mixing and biological activity occurs. It also now has a pair of Chi-pods as well for high frequency measurements.
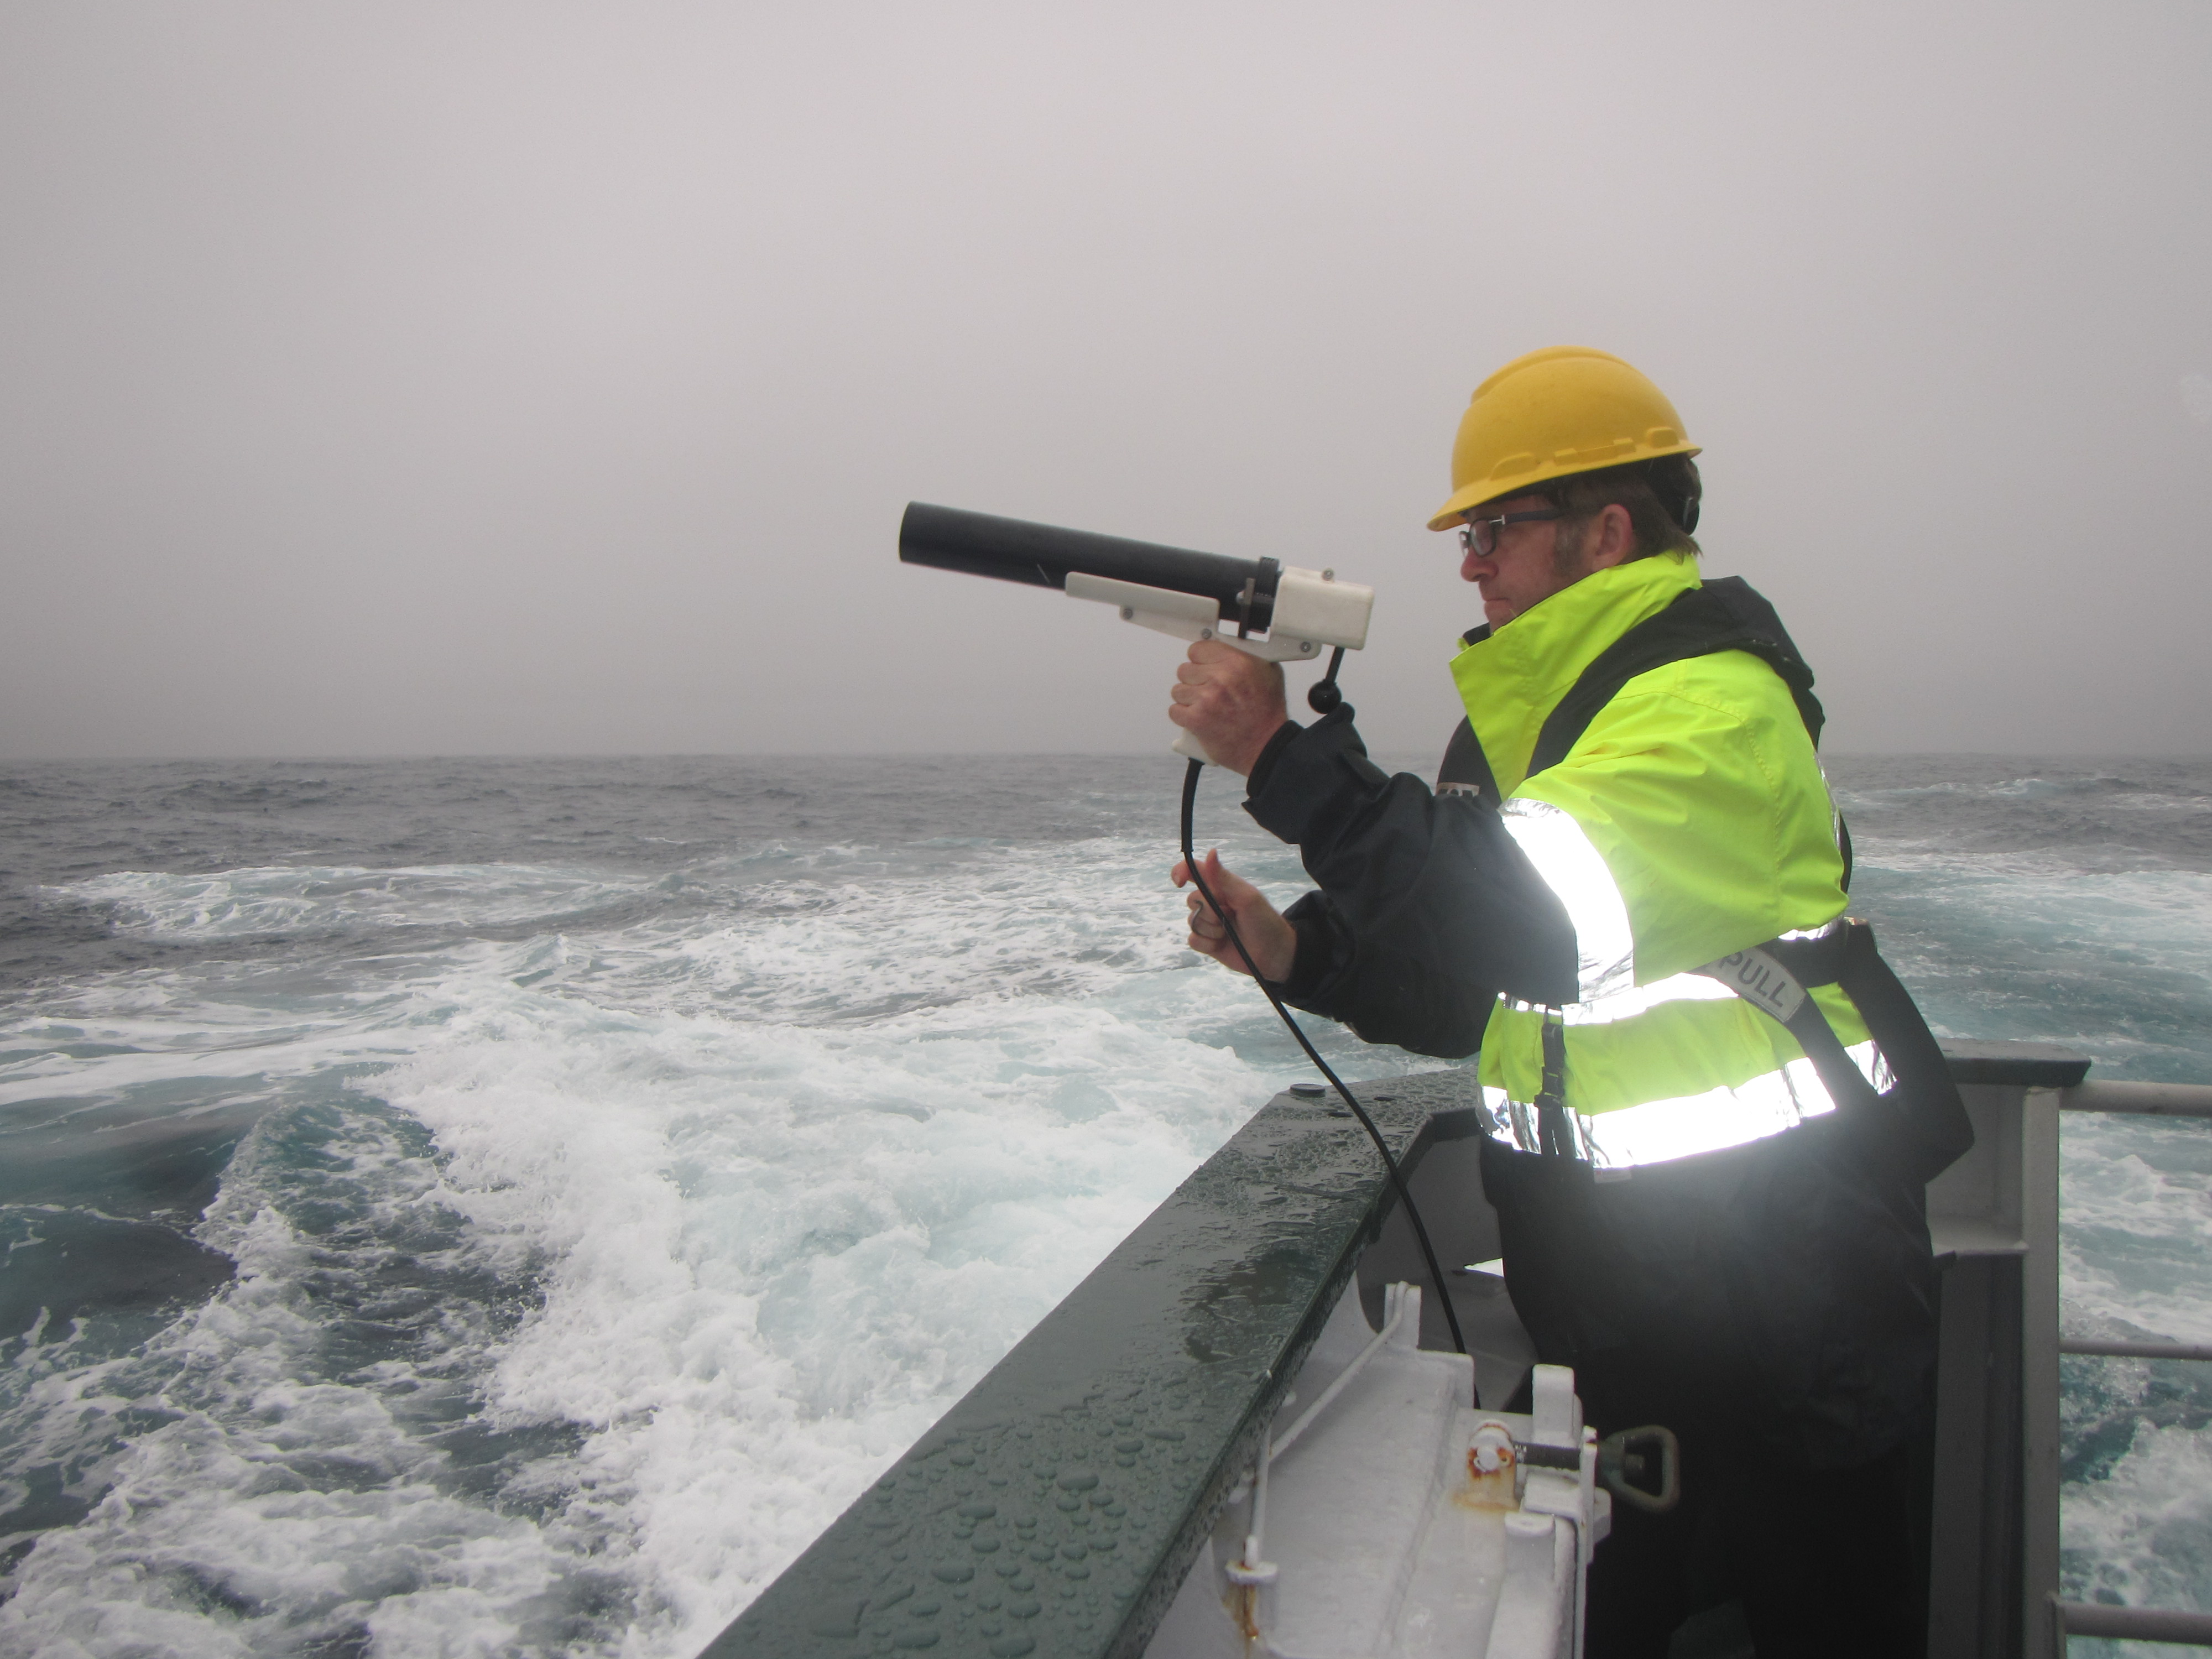
XBT
A very simple instrument with a great ‘secret agent’ sounding name. The acronym stands for Expendable Bathythermograph. These have been used for decades to help oceanographers measure temperatures in very deep waters all over the world without the aide of very specialized equipment. They consist of a zinc weight, temperature probe (thermistor is the correct term), and spool of copper thread, deployed from a gun with an electronic sensor directly attached to the ship’s data port. The copper thread stays connected to the gun, which sends the information back to the ship, where it is displayed in the control room. The weight falls at a known rate and records temperature along the way, so temperature at each depth is known based on the amount of time passed. When the bottom is reached, the thread is cut (and the weight stays at the bottom of the ocean). T-Beam is using them to measure temperature in between the set T-Beam profiling stations because it can be launched from a moving ship.
And that may be just about all you’ve ever wanted to know about ocean thermography!