It’s hard to believe that we’ve already wrapped up the second student cruise on Falkor. Our trip was primarily focused on building a better understanding of the physical oceanography of the highly energetic hydraulic jump at Kaena Point. We used the fact that this is tidally driven to help maximize our time on the ship; when the tide was flowing north we worked on the northern slope of the ridge, and likewise when the tide was flowing south we headed to the south side.
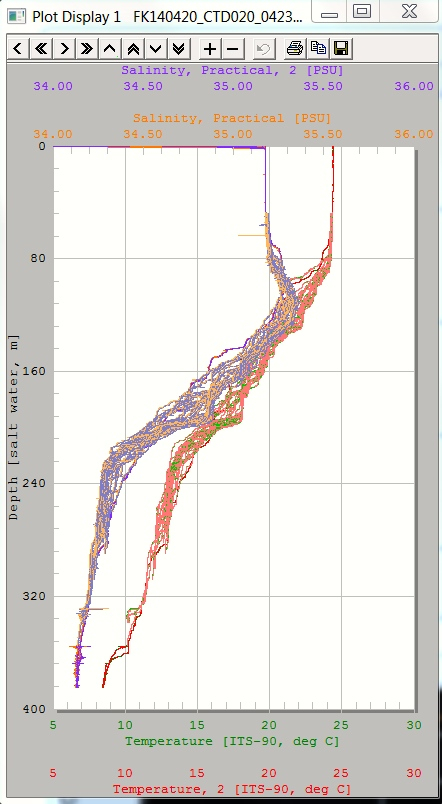
Processing all the data could take months because instruments like the ones we used rapidly collect large amounts of data (the microstructure profiler, for instance, has multiple sensor that store 512 data points a second). But an initial peek at the raw results already reveals a few intriguing points to explore in greater detail. The squiggly lines plotted in the graph to the right correspond to each up or down profile during the tow-yo work with the CTD. Between 150 and 240 meters the lines form a wide swath, indicating that temperature and salinity vary quite a lot at these depths. That means there is indeed a great deal going on at the jump that we’ll need to carefully analyze.
Good Profiles
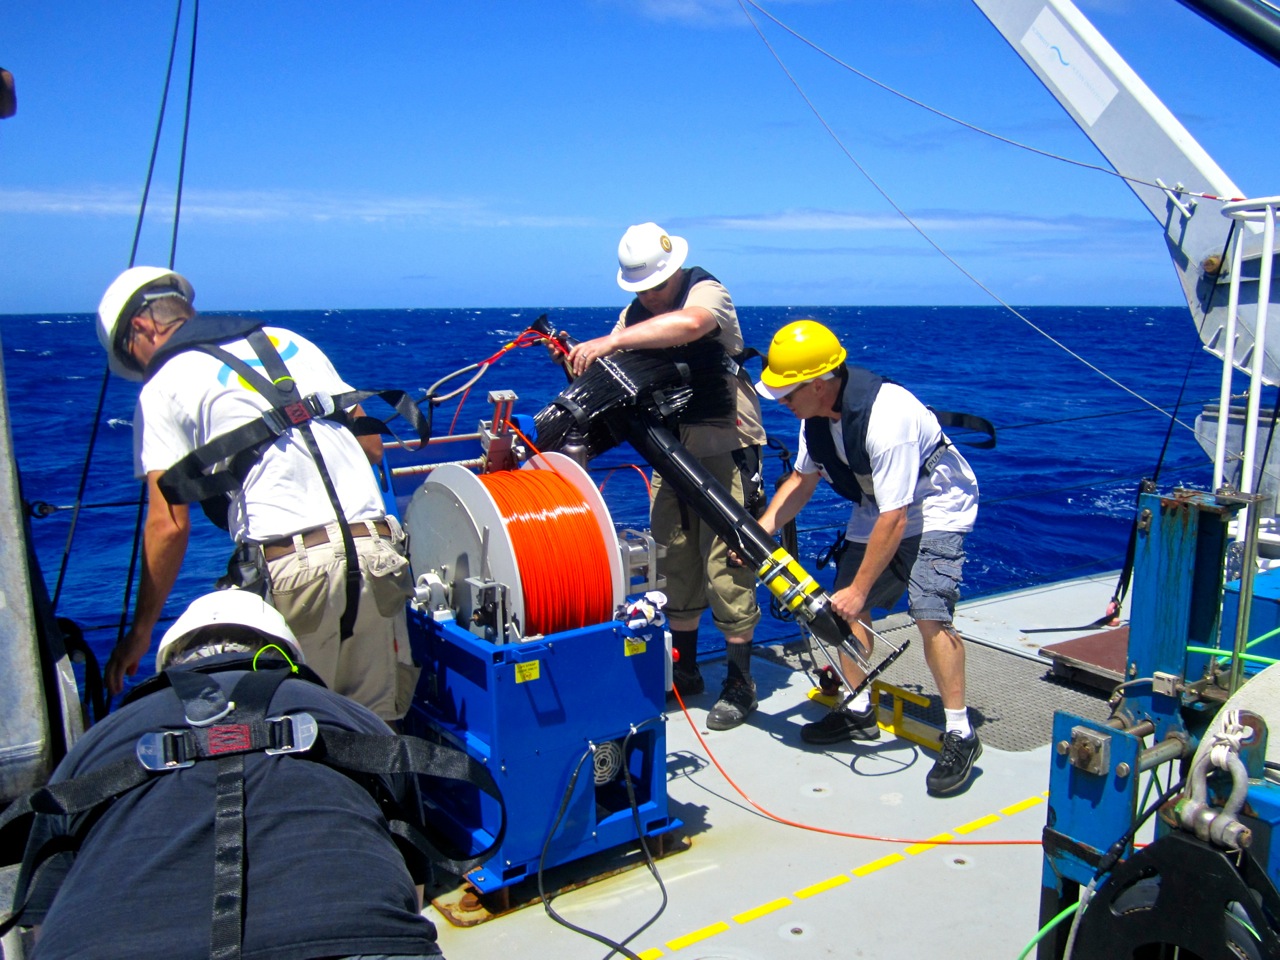
Among other benefits, this trip gave us the chance to test out new equipment, specifically the vertical microstructure profiler (VMP) that was the focus of much of our work. Over the course of four days we completed 37 casts. Although the VMP has a cable back to the ship, it is designed to free-fall on the descent so more line has to be paid out than the instrument needs, but not too much more. The students helped launch the device and then calculated when to stop paying out cable so that when the VMP pulled the cable tight it was still safely above the sea floor.
The VMP will give us valuable turbulence data that tells us about the energetics of the ocean, in particular how fast the ocean currents at Kaena are mixing away or being converted into heat. Figuring out that type of energy balance is important because globally, tides put more energy into the ocean each day than the United States consumes.
The other main objective of this cruise was to take a look at some of the biological factors that impact life on the hydraulic jump. We collected water samples at 12 different stations along the ridge to measure, amongst other things, oxygen content. The students learned valuable sampling techniques on the ship and their learning will continue on shore as they analyze what we collected.
Calling the Shots
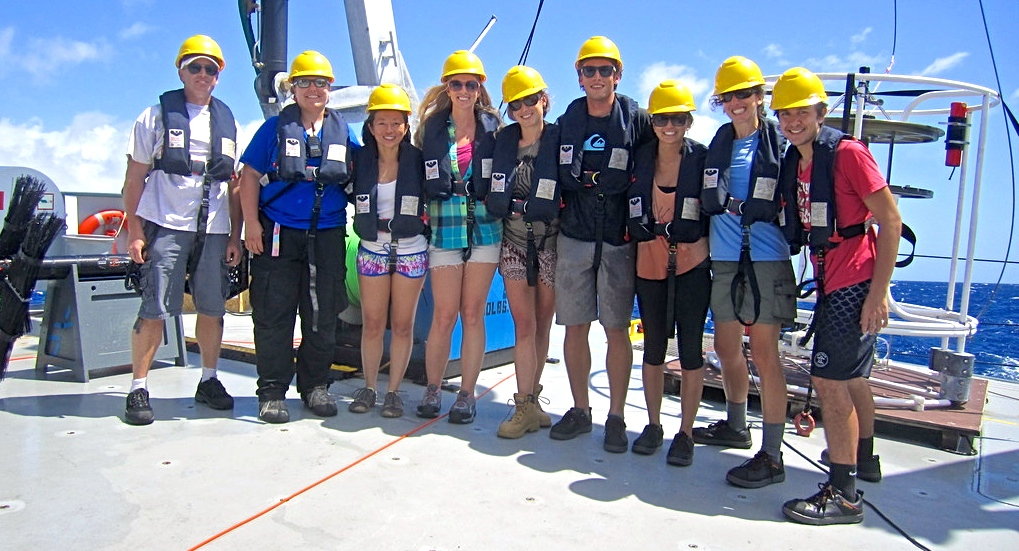
For about half of the students on this cruise, this was their first time at sea. They were excited to have the rare opportunity to get hands-on experience running the shipboard equipment. With supervision from Falkor‘s able marine technicians and crew, the students called the shots: working within our project plan and waypoints, they identified where and when to collect, and learned the ins and outs of storing large amounts of data using computers in the science control room. They rotated 12-hour shifts without complaint (the great coffee was a real boost here), and no matter how tired they were, many found time each evening to enjoy the sunset from the roof deck.
This was an enjoyable and productive cruise. Everyone, students and Falkor crew alike, was enthusiastic and friendly, and they approached all tasks with a ‘can do’ attitude. We would like to thank the Schmidt Ocean Institute for this remarkable learning opportunity.