The R/V Falkor arrived near the dive site last night, but seas were still too heavy to launch instruments over the side. In an effort to use the ship’s resources wisely, the research team immediately started multibeam mapping with the Kongsberg EM302 and EM710.
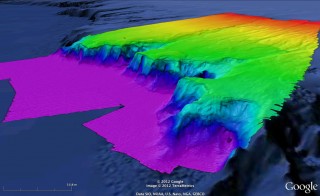
This equipment is being put to test in new terrain. The team mapped a canyon-like feature that runs to the west from our target ‘Okeanos Ridge’, down to the West Florida Escarpment, 30 km away. The feature was observed in Google Earth, and looks to be a promising target for future operations.
During mapping operations, the ship’s multibeam echosounder sends a fan of acoustic beams towards the seafloor and registers the amount of time that it takes for them to be reflected and received back at the ship’s hydrophone receiver array. The amount of time that it takes for the acoustic signals to travel towards the seafloor and return back to the ship’s hydrophone are then used to generate the seafloor depth profile and obtain fine-scale information about features on the seafloor, such as seamounts and canyons.
Multibeam mapping is not just about topography, but also about the ‘hardness’ of the seafloor – that is, rocky versus soft substrate. “If there is a higher acoustic signal amplitude,” explains Schmidt Ocean Institute Marine Technician Paul Duncan “then we would expect to find hard bottom.” Rocky outcrops are of interest to all the biologists, because they serve as attachment points for deep-sea corals. Information about seafloor hardness helps to identify future dive targets. Multibeam data is informative, but also predictive, as changes in slope give an indication of ‘complexity’ of the seafloor, which can indicate coral presence.
Biologists worked with Marine Technicians for almost 24 hours to generate almost 100,000 ‘lines’ of data with considerable overlap to ensure that real acoustic signals can be distinguished from noise. Chief Scientist Peter Etnoyer describes multibeam mapping as “kind of like spray painting. The first pass is a faint line, and the overlap of the next one generates a fuller, more resolved picture.”
Florida State University PhD student Mauricio Silva has been working hard to clean up the incoming data using CARIS HIPS software. He says, “movement like the ship’s pitch, heave, and roll can affect the quality of the multibeam data. If you find high pitch, then you may also find noise, and you can then go into the data and delete that signal, as it is outside the normal expected range.” This noise may confound the profile and give the impression that a region is deeper or shallower than it really is. After this first manual check of the data, other automated programs are used to further refine the results.
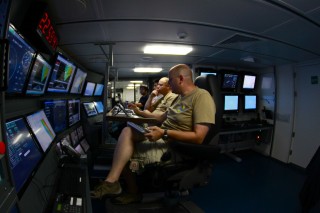
The live multibeam feed is being fully integrated into the ship’s Video Matrix system. The Video Matrix allows high quality information to be transferred from anywhere on the ship to anywhere else – this means that multibeam data, video from the ROV, ship board CCTV cameras, and other oceanographic instruments, can be transmitted to 32 monitors throughout the ship, in addition to 24 within the Science Control Room. “We want to offer significant infrastructure to the scientific community, and we want to have a high impact” says Marine Technician Nathan Cunningham. “High impact is not just about the science, but also the data we can obtain and transmit.”
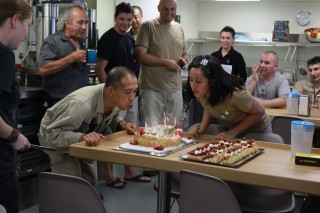
Choppy seas continue to delay ROV operations, however spirits remain high. The birthdays of crewmembers Leny Pancito and Ramon Tabaque were celebrated today in the ship’s mess. Ramon treated everyone to songs on the guitar, including his own R/V Falkor rendition of ‘Yellow Submarine’.
2014 Update:
The resulting bathymetric data from the multibeam mapping of the West Florida Escarpment using Falkor’s Kongsberg EM310 and EM710 is being stored at, and is downloadable from, NOAA’s National Geophysical Data Center. The multibeam mapping was conducted Augusts 27 – September 1, 2012, with Falkor departing from St. Petersburg, FL and returning to Pascagoula, MS.
West Florida Escarpment bathymetric map fly through narrated by Schmidt Ocean Institute Marine Technician Paul Duncan. Video credit: Schmidt Ocean Institute, Google Earth.