The Falkor’s first science cruise is focusing on mapping the Campeche Escarpment between water depths of 400 m to its base at 3700 m. The capability of the Falkor’s multibeam sonar is clearly illustrated by comparing the previously available bathymetric data with the new bathymetry.
Figure 1.
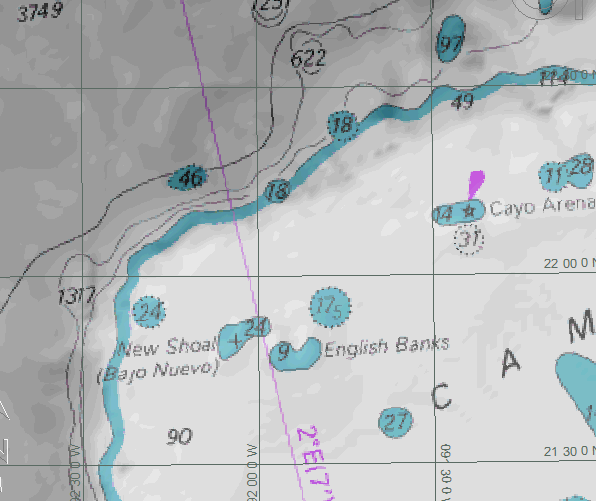
The best bathymetric data available at the time we set sail on this cruise is a combination of the hydrographic charts designed for navigation, emphasizing shallow waters, and the satellite altimetry set, which provides a bathymetric estimation of the entire Earth’s ocean floor. Both are at a very low resolution. Note that the escarpment is almost entirely lacking in detail in the old data. (The depths on this chart are in fathoms, which equal 6 feet). Image credit: UK Hydrographic Office (chart), Sandwell and Smith (satellite data)
Figure 2.
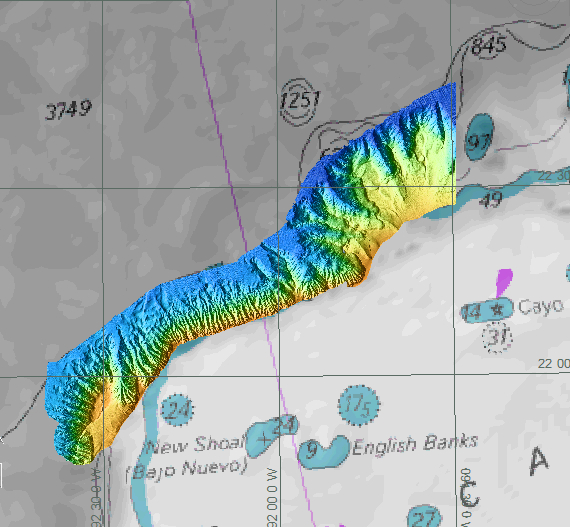
shows the same area as Figure 1 but with some of the new multibeam data overlain over the same chart. The depths of the multibeam data range from 400 to 3700 meters, with the blue being the deepest area. The enhanced resolution reveals numerous features previously unknown. For example, the face of the escarpment is cut by multiple submarine canyons. Image credit: UK Hydrographic Office (chart), Sandwell and Smith (satellite data), Monterey Bay Aquarium Research Institute, Schmidt Ocean Institute (high resolution bathymetry)
Figure 3.
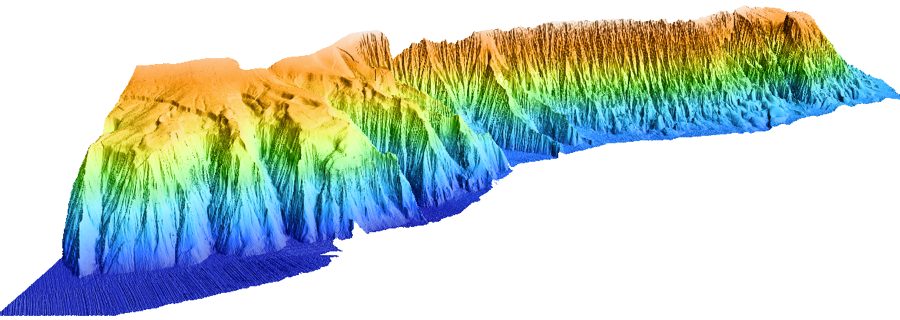
Perspective view of Campeche Escarpment generated with the multibeam data newly acquired by researchers onboard R/V Falkor. Image credit: Monterey Bay Aquarium Research Institute, Schmidt Ocean Institute
A prespective view of the same multibeam data viewed from the north with 5X exaggeration provides more exquisite details. The survey shows that the entire face of the escarpment has experienced substantial erosion and leaves the strata of the adjacent platform exposed in a layer cake fashion along its sloping face. Of particular interest is that the Cretaceous Tertiary Boundary section and presumably the ejecta from this event are likely exposed along this cliff face. The survey is providing a roadmap which can be used to conduct very targeted sampling of the exposed strata.